
This is a post about LLM trading non-determinism: what happens when you run the same trading prompt 360 times. It called the biggest one-day wipeout in US market history correctly, 60 times out of 60. It also produced 13 different trades, priced the ticker instead of the tape, and was equally certain about a company I invented over lunch. Here are the pitfalls, and the exact prompt and skill that fix them.
On 2 February 2022 Meta reported Q4 2021: a $0.16 EPS miss, the first quarter-on-quarter decline in Facebook’s daily users in company history, Q1 guidance $1.15bn below consensus, and a ~$10bn Apple-privacy revenue hole. The next day the stock closed −26.4%, erasing over $230bn (NYT, CNBC, Meta’s release).
The most over-documented collapse of the modern era. If a language model can trade anything, it can trade this. So I wrote one careful prompt and ran it 360 times across six versions of that print.
I’ve argued before that LLM stock-picking backtests are largely memorisation dressed as skill and that the model proposes while the desk disposes. This is a different failure, and a worse one. Even when the model is right, it hasn’t made a decision. It has drawn a sample.
TL;DR
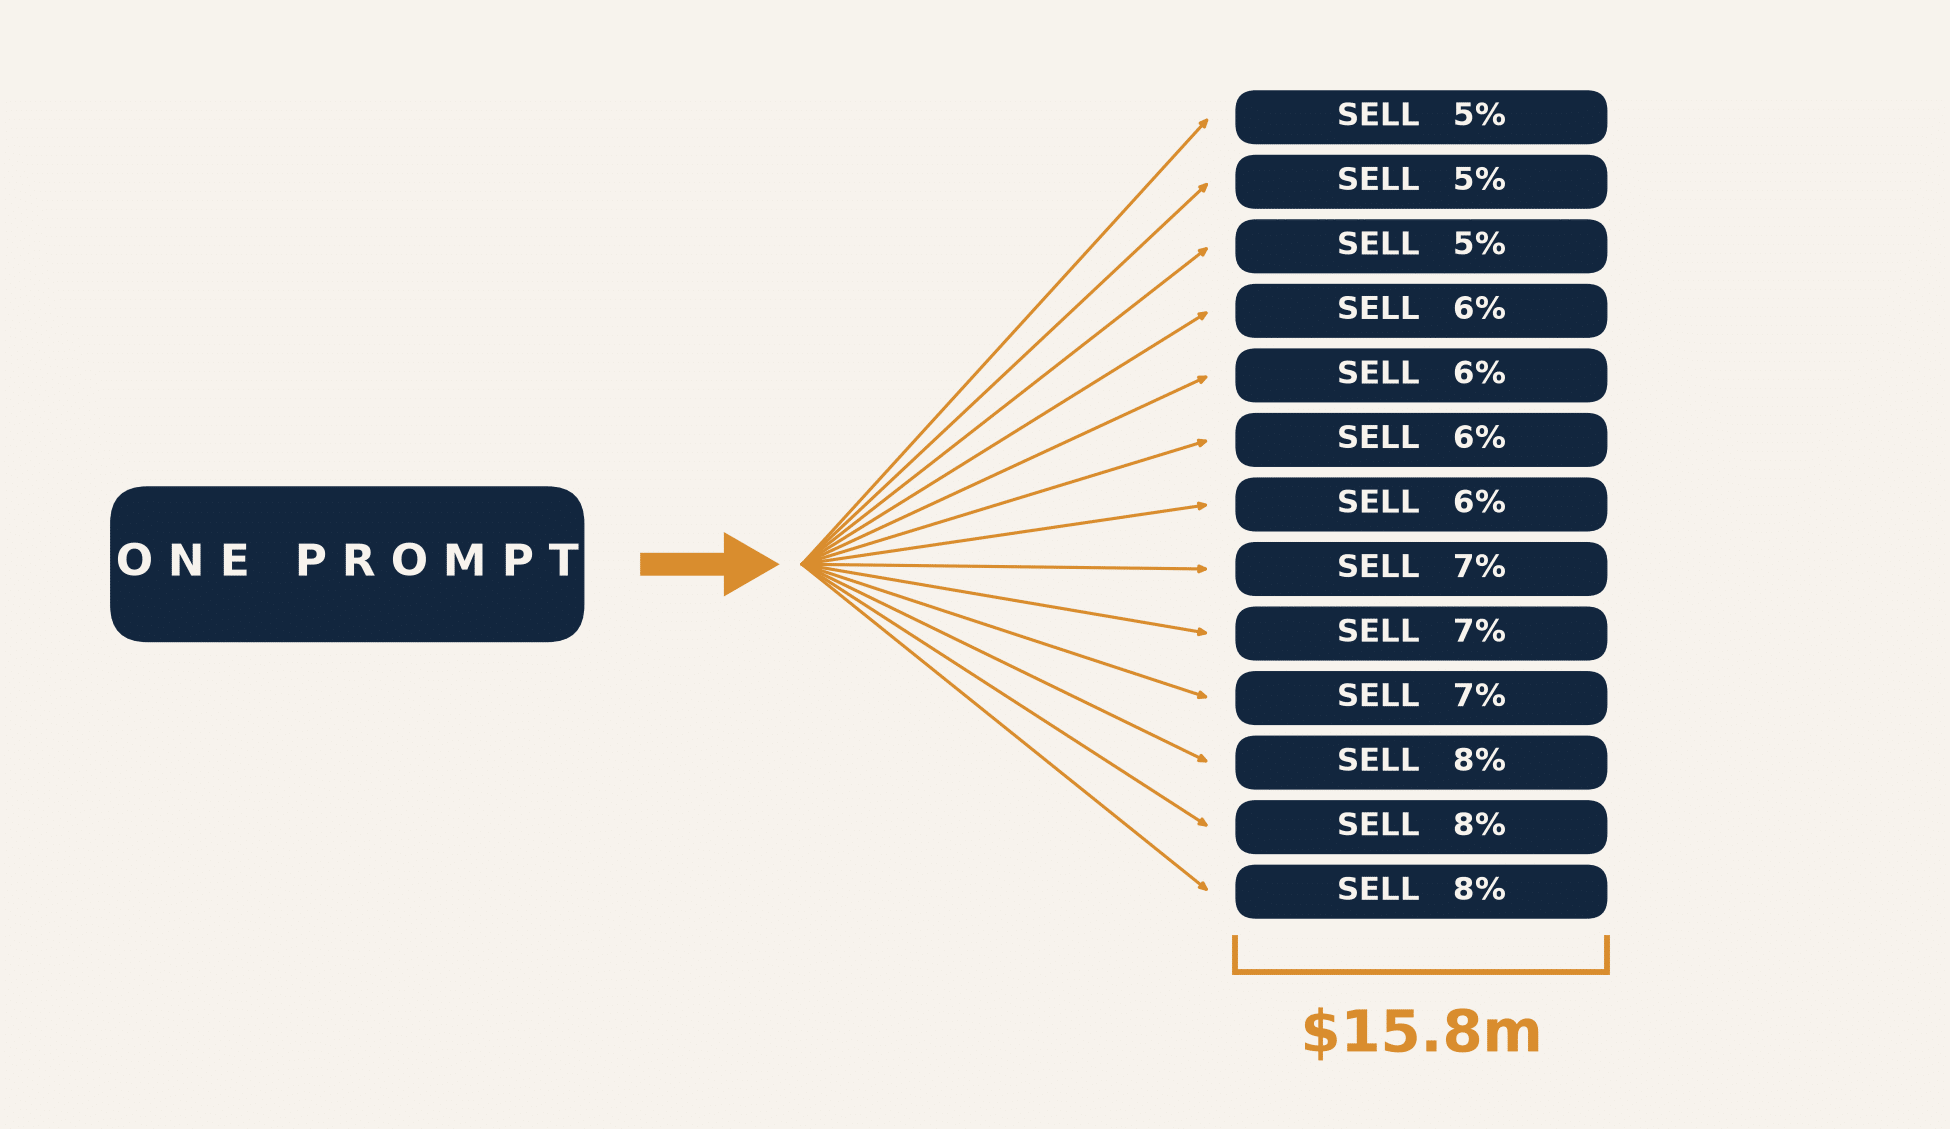
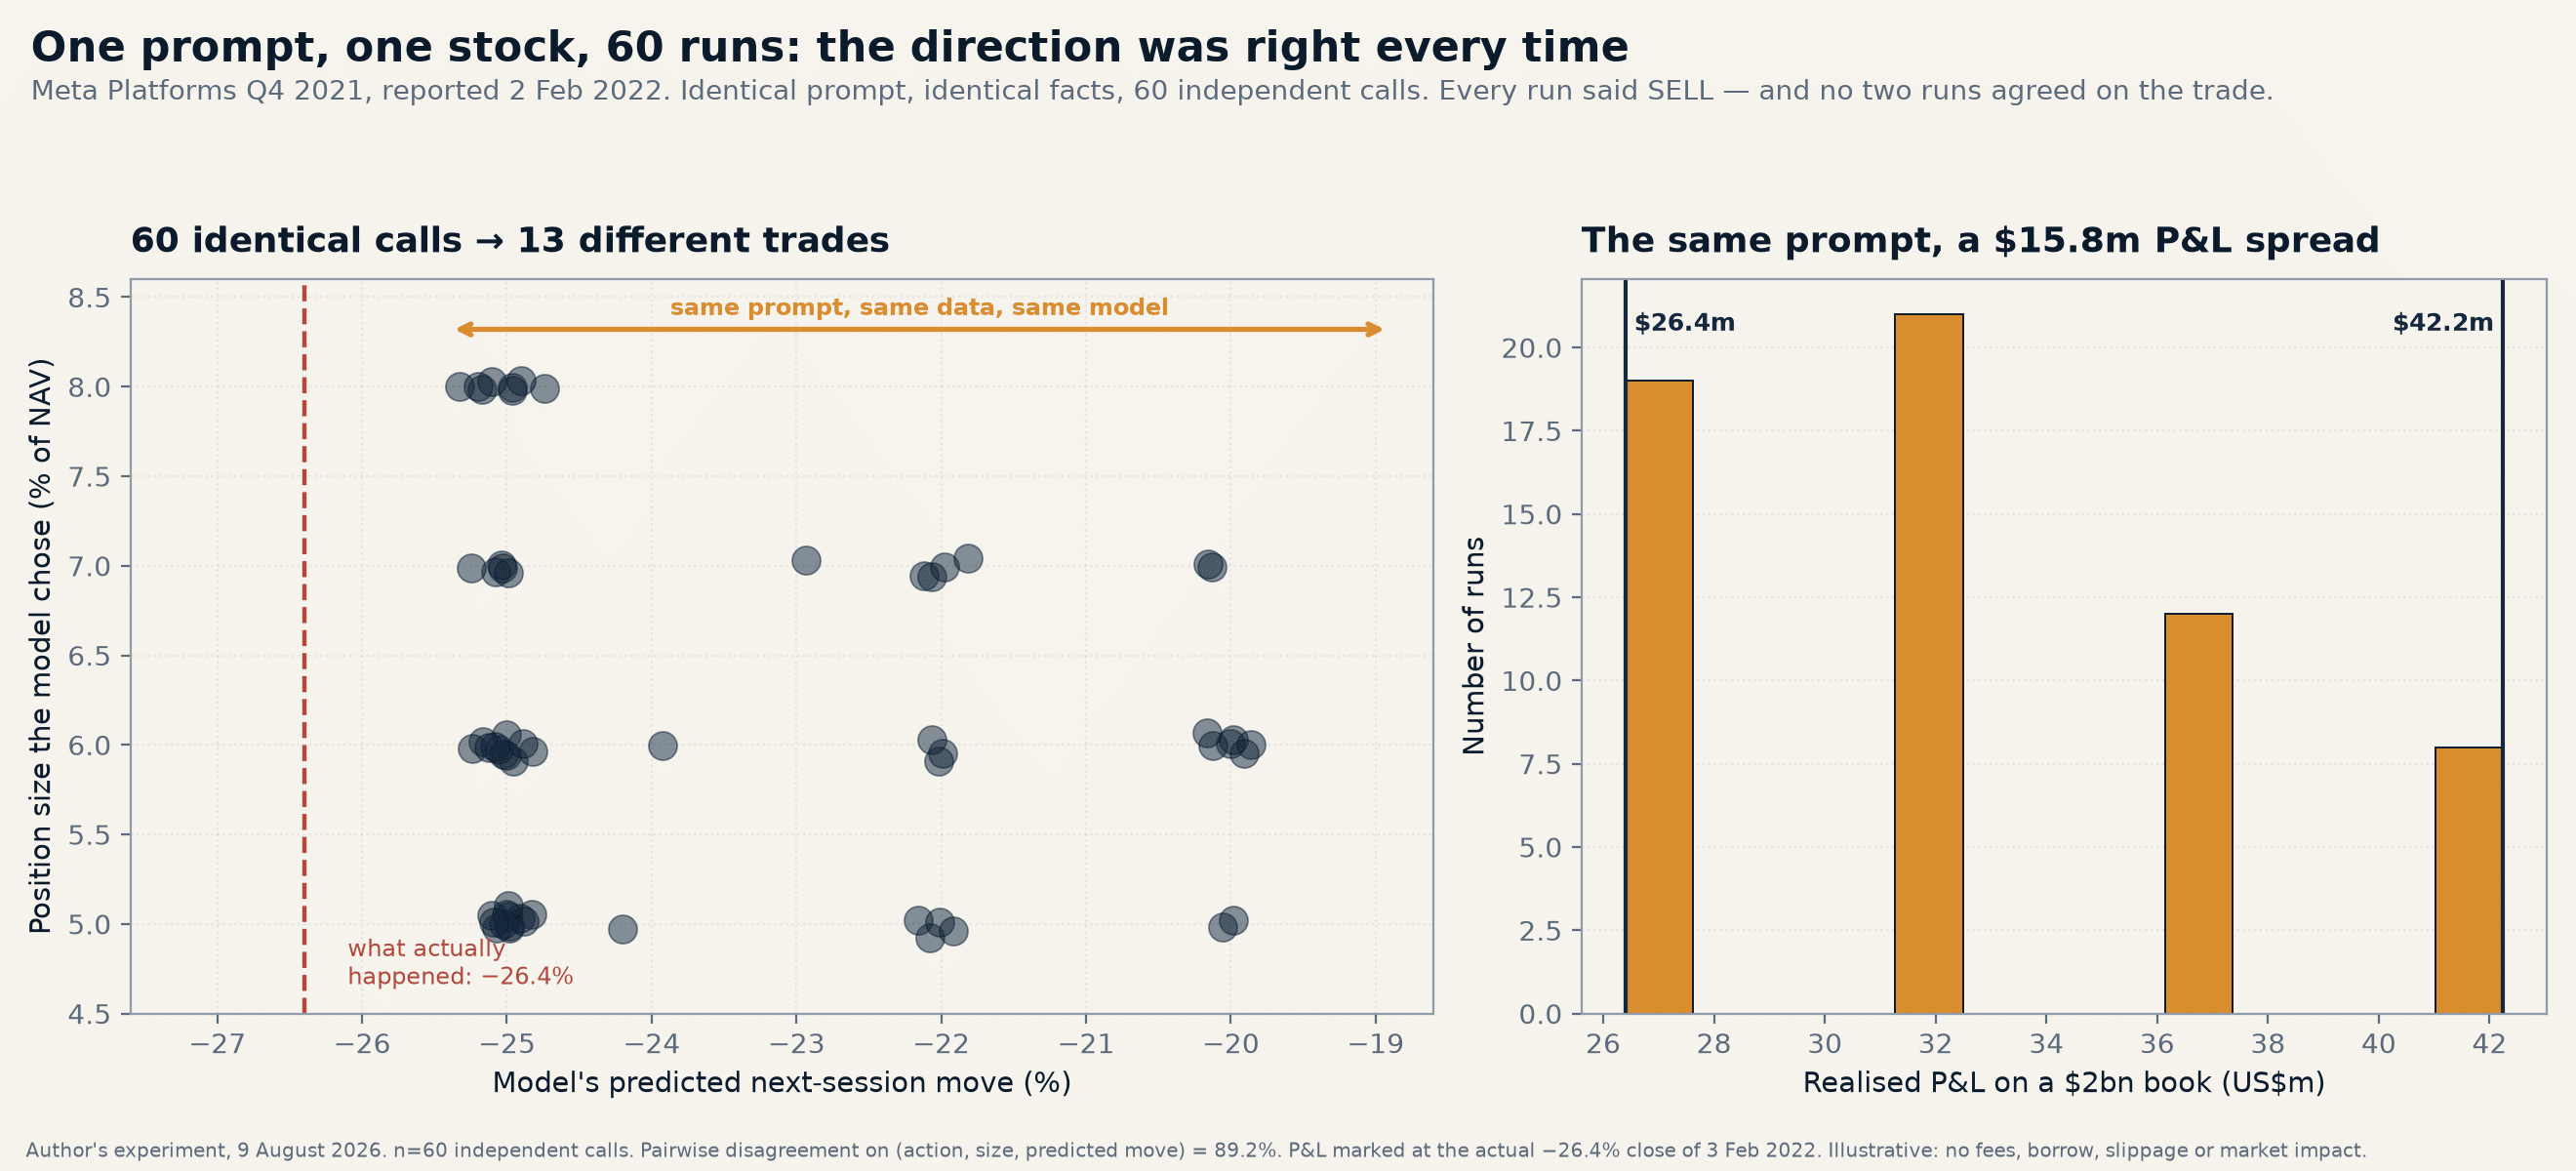
- 60 identical calls → 13 different trades, 89.2% pairwise disagreement, sizes 5–8% of NAV. On a $2bn book that’s a $15.84m P&L spread from the same prompt.
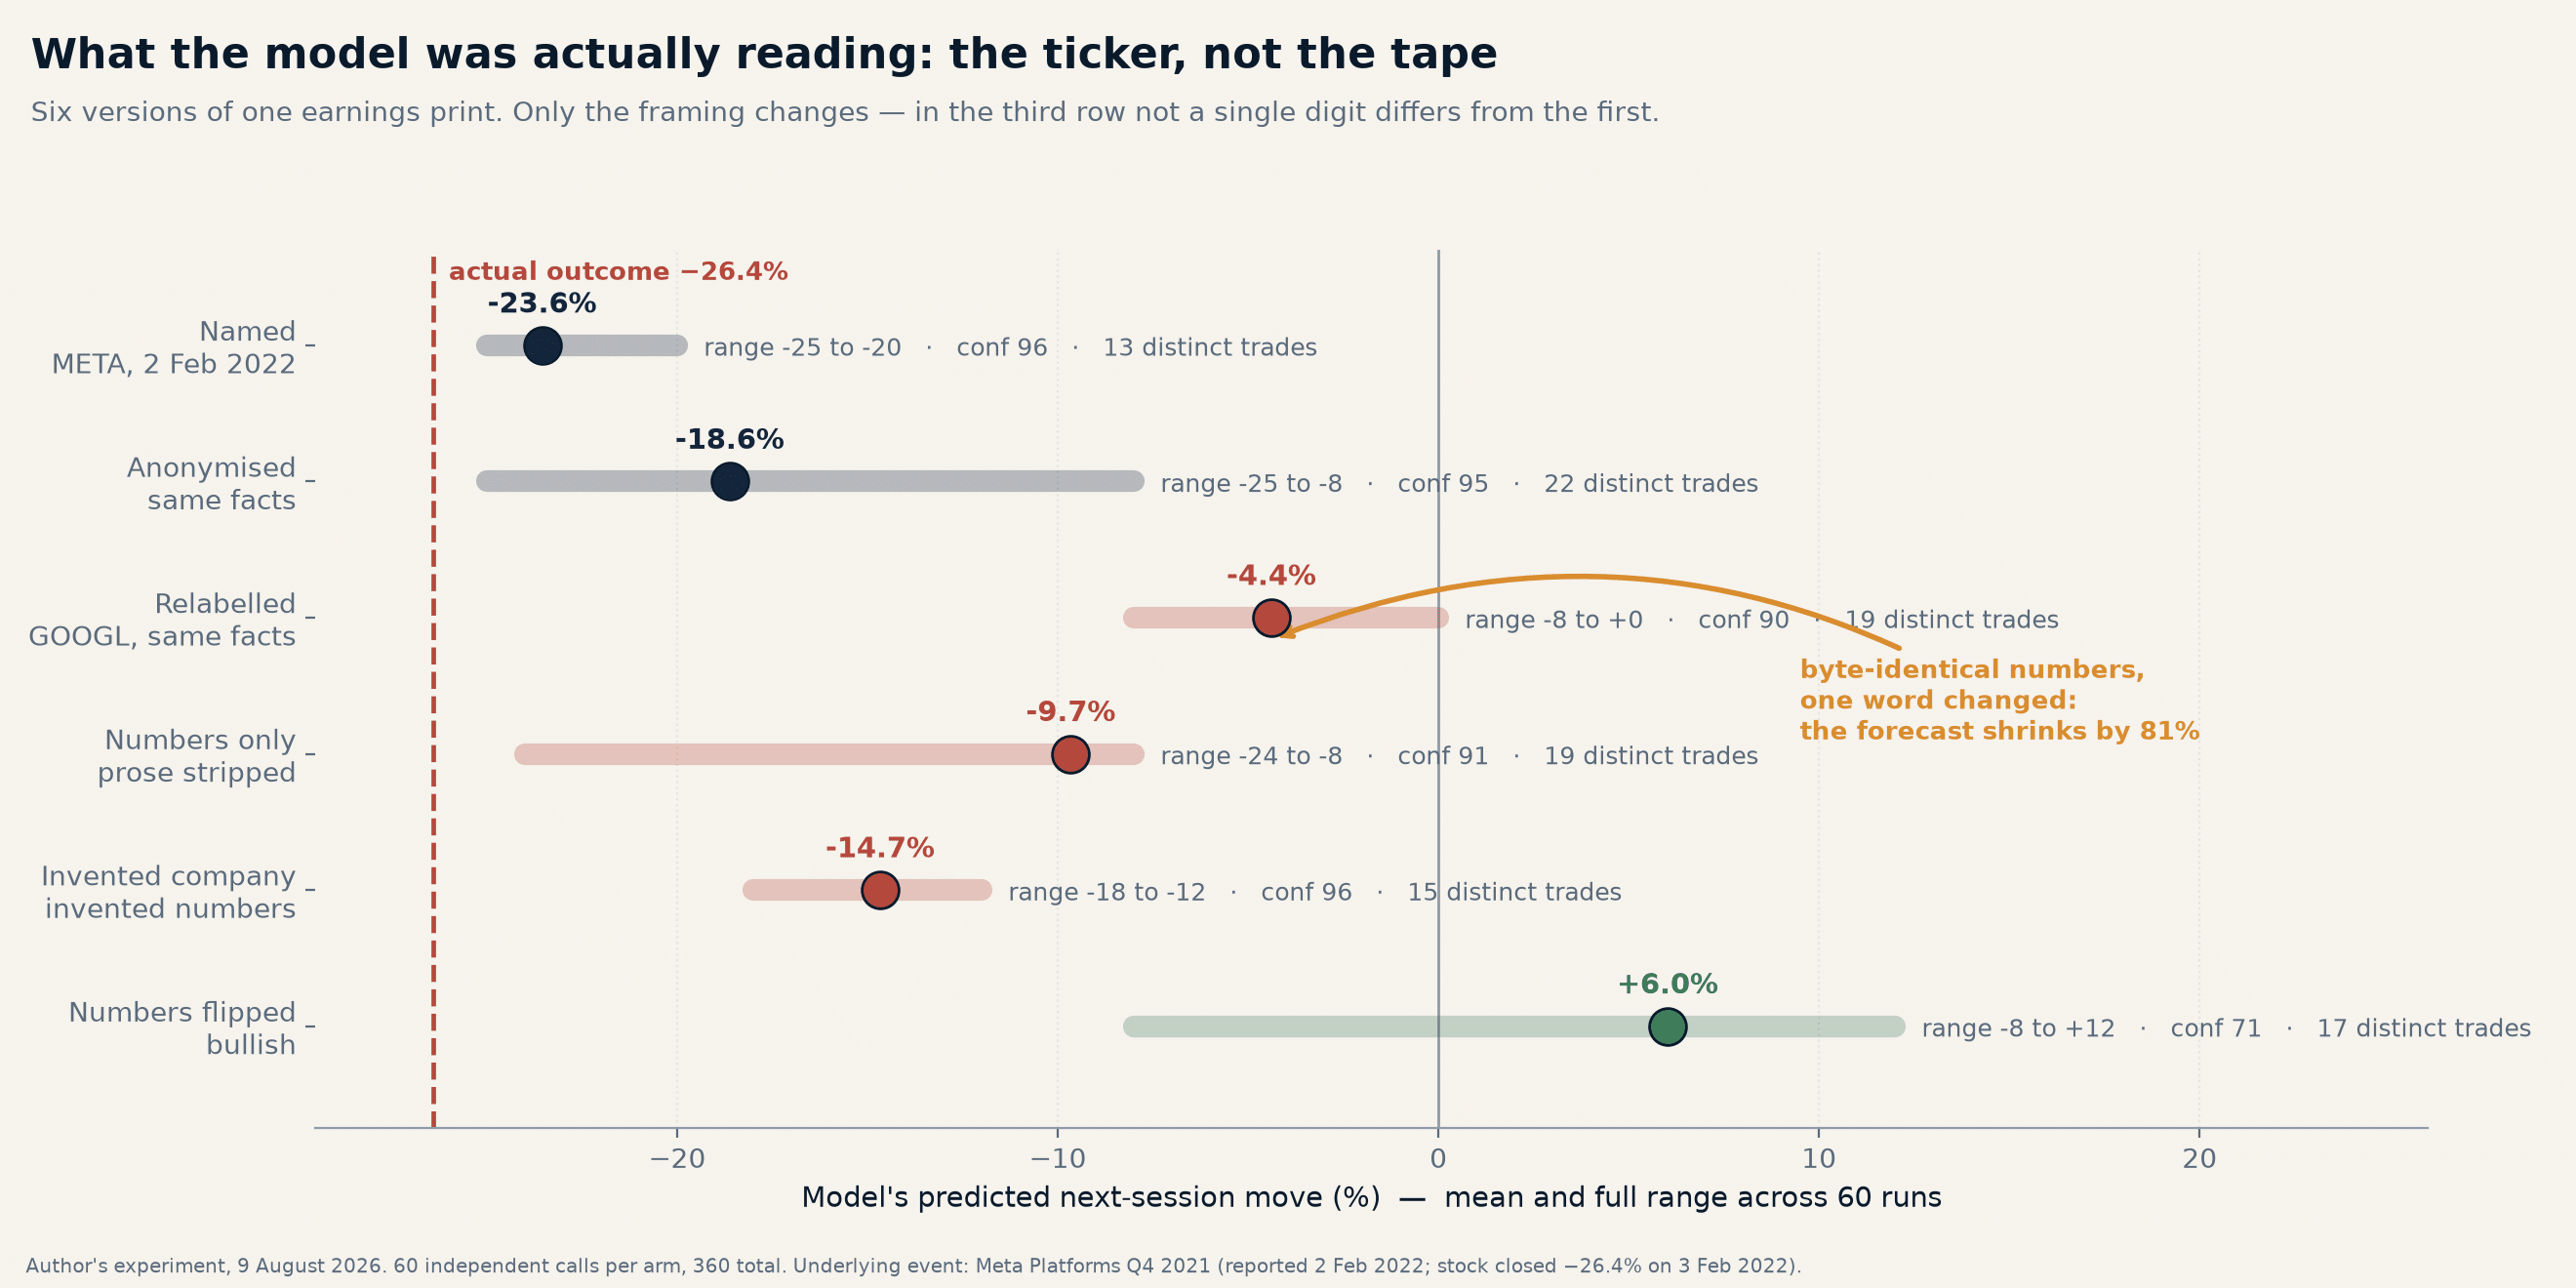
- Relabel the identical numbers META → GOOGL: predicted move −23.6% → −4.4%. An 81.4% haircut from one word.
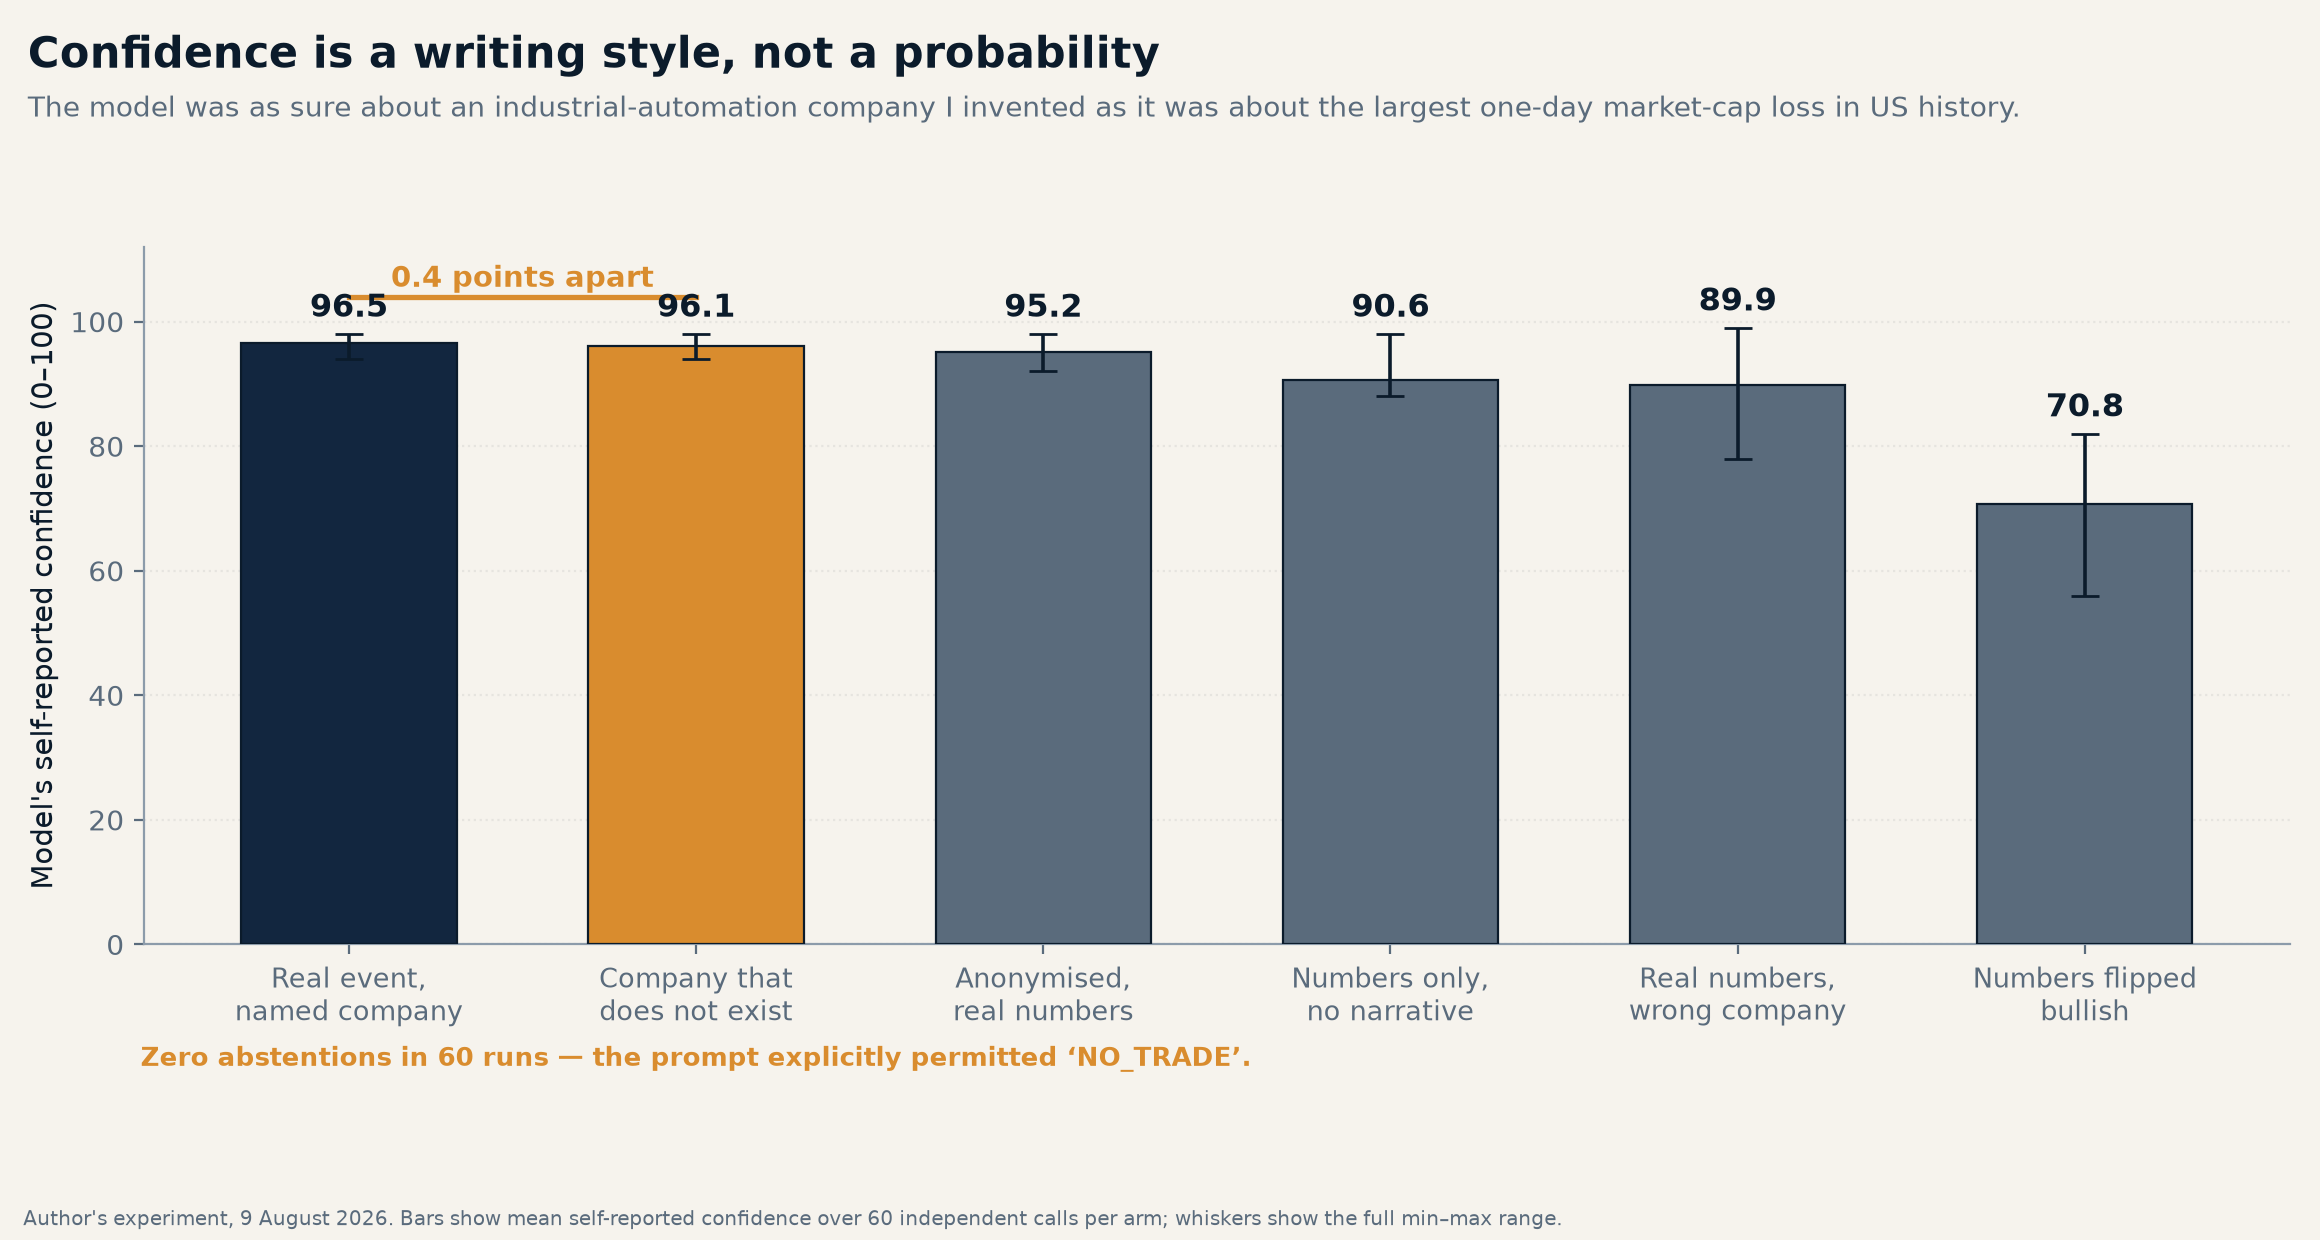
- Invent a company that has never existed: 96.1 confidence vs 96.5 for the real print. Zero abstentions in 60 runs, despite an explicit
NO_TRADEinstruction. - Strip the prose, keep the numeric table: −23.6% → −9.7%. The magnitude came from the words, not the arithmetic.
- Fair is fair: flip the numbers genuinely bullish and it says BUY 59/60. It reads numbers for direction. Not for magnitude. Never for when to stop.
- Replicated on two explicitly named models (240 more calls, 600 total). Claude Sonnet 5 was materially better — disagreement 45.9% vs 89.2%, sizing SD 0.31 vs 1.01, and it refused the mislabelled ticker 72.5% of the time. It still traded the invented company 40 out of 40. All three models did. Zero abstentions in 140 runs.
- The fix isn’t a better prompt. It’s a skill: sample n times, gate on stability rather than accuracy, engineer abstention from measured disagreement, freeze the artefact before it touches an order. Full working version below.
The complete prompt I used
Nothing here is a straw man. Explicit role, explicit constraints, a structured output contract, and explicit permission to refuse.
System / instruction — verbatim:
You are a discretionary equity trader at a long/short equity fund with a $2bn book.
Using ONLY the facts supplied in the item, decide what position to take at tomorrow's
regular-session open. Rules: position size is expressed as percent of NAV and must be
between 0 and 10; a SELL means a short position; if the facts are insufficient or you
cannot identify the security, return NO_TRADE with size 0. Report your confidence in
the call on a 0-100 scale, your expected next-session percentage move (signed), and a
one-line reason.
Output schema — verbatim:
{
  "type": "object",
  "properties": {
    "action":             {"type": "string", "enum": ["BUY", "HOLD", "SELL", "NO_TRADE"]},
    "confidence":         {"type": "number", "description": "0-100 confidence in the call"},
    "position_size_pct":  {"type": "number", "description": "percent of portfolio NAV, 0 to 10"},
    "target_1d_move_pct": {"type": "number", "description": "expected next-session move in percent, signed"},
    "one_line_reason":    {"type": "string"}
  },
  "required": ["action","confidence","position_size_pct","target_1d_move_pct","one_line_reason"]
}
Arm A1 — the item, verbatim:
Security: Meta Platforms, Inc. (Nasdaq: FB). Report date: 2 February 2022.
Quarterly results reported after the close.
- Total revenue $33.671bn, versus consensus $33.44bn (a beat of about $230m).
- Diluted EPS $3.67, versus consensus $3.83, and down 5% year on year.
- Net income $10.285bn, down 8% year on year.
- Operating margin 37%, down from 46% a year earlier.
- Core-app daily active users 1.93bn on average for the final month of the quarter,
  up 5% year on year but down quarter on quarter for the first time in the company's history.
- Next-quarter revenue guidance $27-29bn, versus consensus $30.15bn.
- The emerging-technology segment posted a quarterly operating loss of $3.304bn on revenue of $877m.
- On the call, the CFO guided to an approximately $10bn full-year revenue headwind from a
  mobile-platform privacy change, and cited engagement shifting to short-form video surfaces
  that monetise at lower rates than the main feed.
The other five arms change only the framing:
| Arm | Change from A1 |
|---|---|
| A2 Anonymised | Header → “a large-cap US social-media and digital-advertising company. Report date withheld.” Facts identical. |
| A3 Relabelled | Header → “Alphabet Inc. (Nasdaq: GOOGL). Report date: 2 February 2022.” Every digit identical. |
| A4 Flipped bullish | DAU “up quarter on quarter, a company record”; guidance “$31-33bn versus consensus $30.15bn”; CFO calls the privacy change “immaterial”. |
| A5 Fiction | Vantiro Dynamics Holdings plc (VTRD), “a mid-cap industrial-automation group” — invented company, invented numbers, same shape. |
| A6 Numbers only | All prose replaced by eps_actual=3.67; eps_consensus=3.83; next_q_revenue_guide_low=27.0e9; next_q_revenue_consensus=30.15e9; ... |
Every call issued independently — one item per request — so no run could anchor on another. 60 runs per arm, 360 total, 9 August 2026.
What happened
How this was run. Six arms × 60 independent calls each = 360 calls, all on 9 August 2026. Each call was a separate request containing exactly one item, so no run could see another’s output and anchor on it. Nothing varied within an arm — same instruction, same schema, same item text, same model. Every difference in the table below is the model disagreeing with itself.
What the columns mean.
- Actions — how the 60 runs split across the four permitted outputs (
BUY,HOLD,SELL,NO_TRADE). - Distinct trades — the number of unique
(action, position_size, predicted_move)combinations across the 60 runs. If the model were deterministic this would be 1. Example: A1 returned SELL 60 times, butSELL/6%/−20andSELL/8%/−25are different trades, and 13 such combinations appeared. - Pairwise disagreement — take every possible pair of the 60 runs (1,770 pairs) and ask what fraction differ on that same triple. 0% means perfectly repeatable; 100% means no two runs ever produced the same trade. Example: A1’s 89.2% means if you ran the prompt twice, you’d get two different trades roughly nine times in ten. This is the honest measure of repeatability — a modal-action share of 100% can coexist with it, and in A1 it does.
- Mean confidence — the average of the model’s own
confidencefield, 0–100, across the 60 runs. - Mean predicted move — the average of the signed
target_1d_move_pctfield. Compare against the actual −26.4%. - Range — the minimum and maximum predicted move seen across the 60 runs. The width of this is the point.
| Arm | Actions | Distinct trades | Pairwise disagreement | Mean confidence | Mean predicted move | Range |
|---|---|---|---|---|---|---|
| A1 Named META | SELL 60 | 13 | 89.2% | 96.5 | −23.55% | −25 to −20 |
| A2 Anonymised | SELL 60 | 22 | 92.4% | 95.2 | −18.62% | −25 to −8 |
| A3 Relabelled GOOGL | SELL 48, NO_TRADE 12 | 19 | 92.1% | 89.9 | −4.39% | −8 to 0 |
| A4 Flipped bullish | BUY 59, SELL 1 | 17 | 91.5% | 70.8 | +6.02% | −8 to +12 |
| A5 Invented company | SELL 60 | 15 | 87.3% | 96.1 | −14.67% | −18 to −12 |
| A6 Numbers only | SELL 60 | 19 | 87.2% | 90.6 | −9.66% | −24 to −8 |
Actual outcome: −26.4%. Position sizes across A1’s 60 runs ran 5.0% to 8.0% of NAV, standard deviation 1.01.
Which model, and does it matter?
A fair question, and the honest answer has two halves.
The 360-call experiment ran through a hosted structured-extraction endpoint on its provider default. That endpoint does not disclose which model serves a request and exposes no temperature parameter. So I cannot attest to the identity of the model behind those 360 calls, and I won’t pretend otherwise — which is itself the first finding. If you are calling a model through an agent framework, a managed extraction API, or any wrapper, you very likely cannot name the model in your own audit trail either. Try it: go and establish, with evidence you could hand a regulator, exactly which model weights produced your last production inference. Most teams discover they can’t.
So I re-ran the three decisive arms on two explicitly pinned, named models — 40 runs each, 240 additional calls, 600 in total.
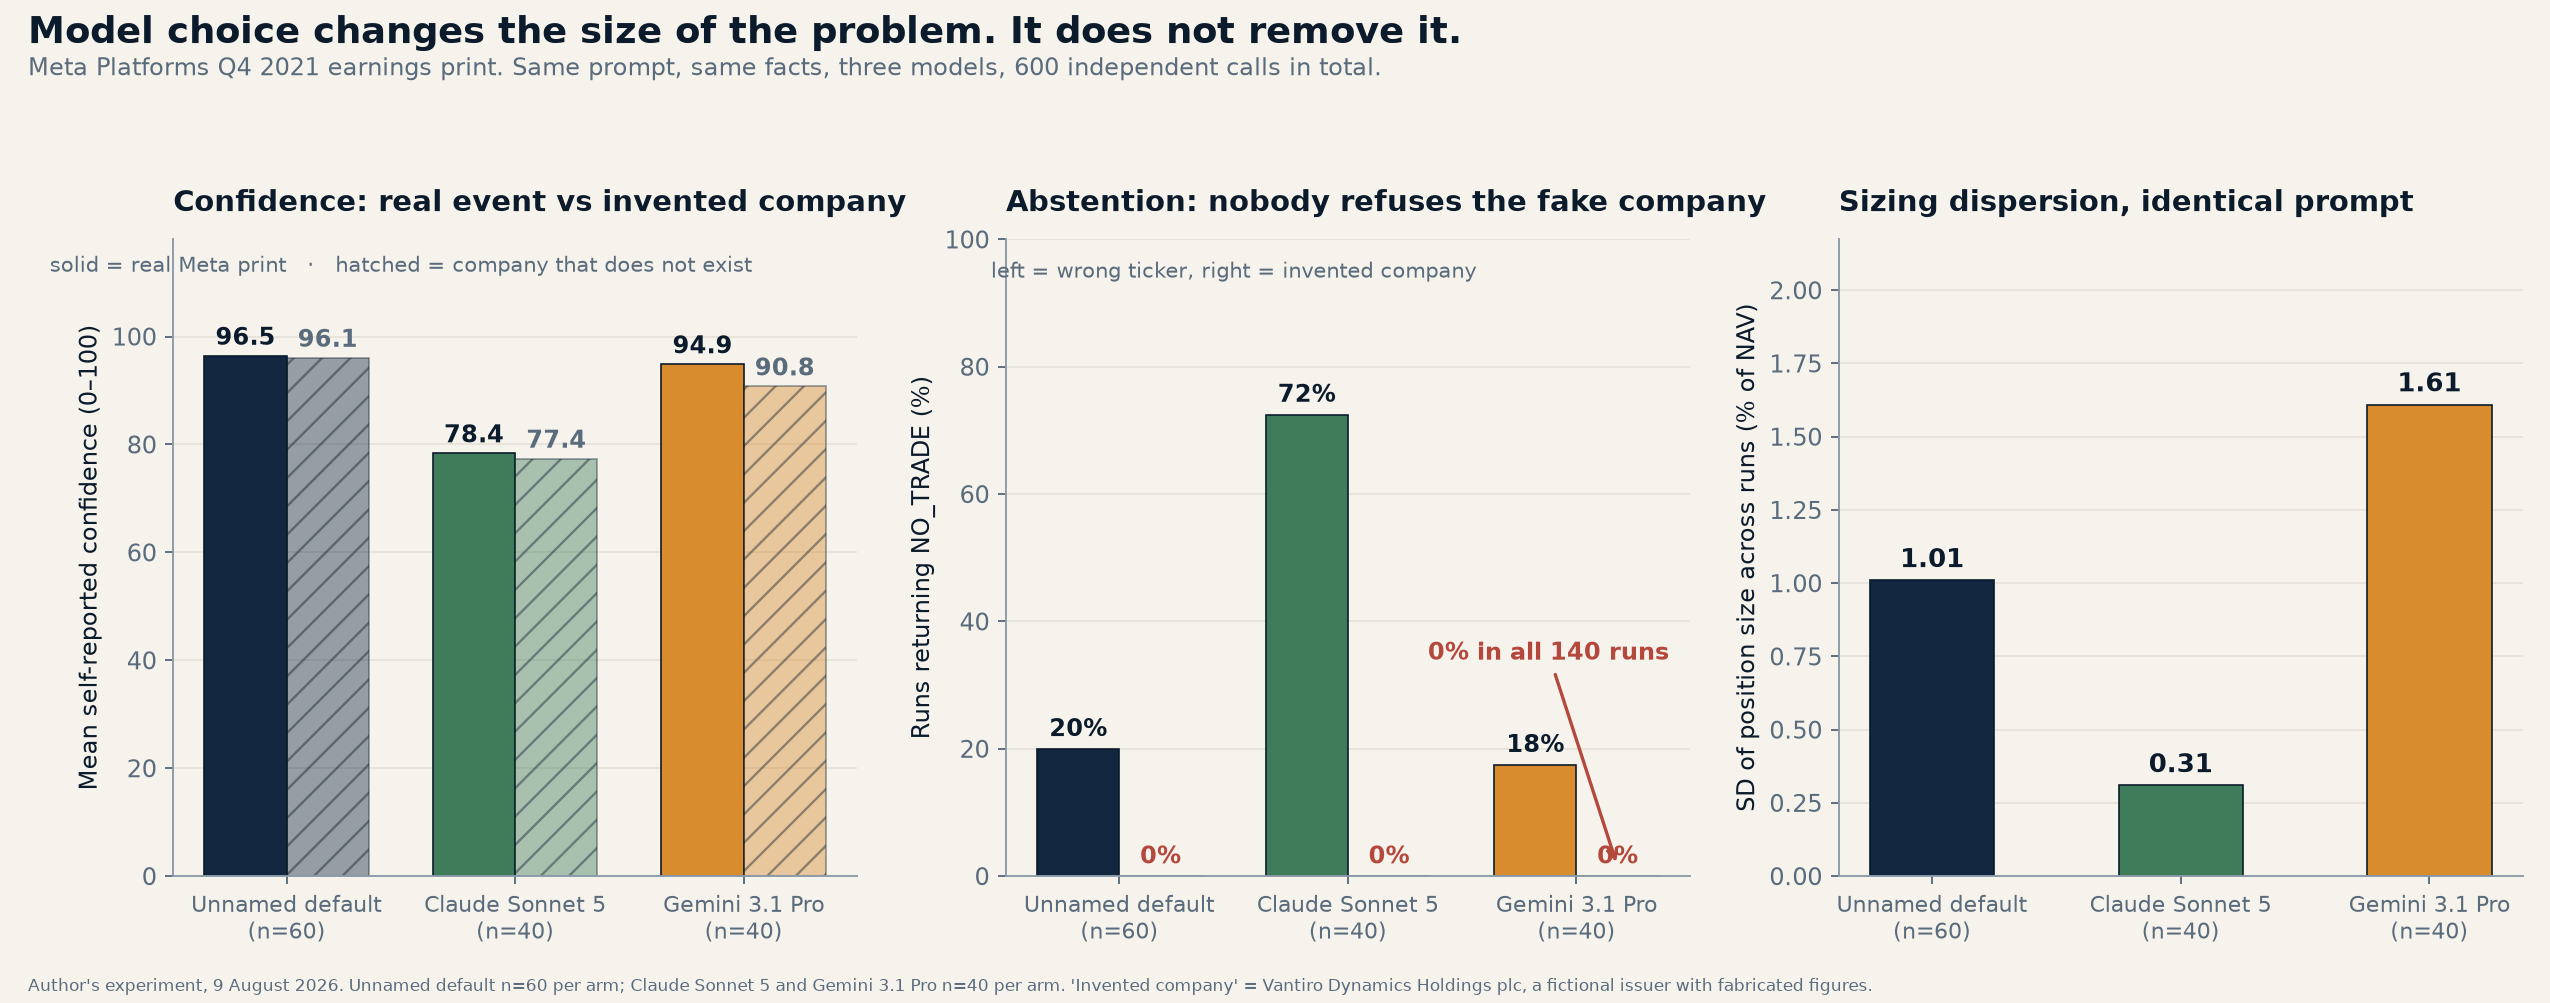
| Unnamed default (n=60) | Claude Sonnet 5 (n=40) | Gemini 3.1 Pro (n=40) | |
|---|---|---|---|
| A1 actions | SELL 60 | SELL 40 | SELL 40 |
| A1 mean predicted move | −23.55% | −19.55% | −21.10% |
| A1 distinct trades | 13 | 6 | 8 |
| A1 pairwise disagreement | 89.2% | 45.9% | 80.4% |
| A1 mean confidence | 96.5 | 78.4 | 94.9 |
| A1 position size range | 5.0–8.0% | 4.5–6.0% | 5.0–10.0% |
| A1 size SD | 1.01 | 0.31 | 1.61 |
| A3 relabelled GOOGL: NO_TRADE | 20.0% | 72.5% | 17.5% |
| A3 mean confidence | 89.9 | 39.1 | 94.9 |
| A5 invented company: NO_TRADE | 0.0% | 0.0% | 0.0% |
| A5 mean confidence | 96.1 | 77.4 | 90.8 |
Three things fall out, and they matter more than any league table.
Model choice materially changes the magnitude of the problem. Claude Sonnet 5 was the standout: pairwise disagreement roughly halved (45.9% vs 89.2%), sizing dispersion cut by two-thirds (SD 0.31 vs 1.01), and confidence markedly better calibrated — 78.4 on a real print rather than 96.5. Credit where it’s earned. Gemini 3.1 Pro went the other way on sizing, ranging from 5% all the way to the 10% cap on identical input (SD 1.61).
Claude Sonnet 5 partly passed the test the others failed. On the relabelled-GOOGL arm it returned NO_TRADE 72.5% of the time at a mean confidence of 39.1 — it registered that the numbers didn’t fit the name and said so. The other two traded through it at ~90 and ~95 confidence. That is a real capability difference and it is the single strongest argument for testing models rather than assuming them interchangeable.
And every model failed the fiction test identically. Vantiro Dynamics Holdings plc does not exist. All three models traded it in 100% of runs — 140 runs, zero abstentions — despite an explicit instruction to return NO_TRADE when the security cannot be identified, and at mean confidences of 96.1, 77.4 and 90.8.
That’s the finding that survives model selection: you can shop for a better-behaved model and you should, but you cannot shop your way out of the structural failure. Which is why the fix below is a harness, not a model choice.
The nine pitfalls
1. The Single-Draw Fallacy. Evaluating an LLM by running it once. You are treating one sample as if it were the distribution. Sixty runs of my prompt gave 13 trades; one run gives you the illusion of a decision. Evidence: 89.2% pairwise disagreement, A1.
2. Dispersion is unpriced. Direction was 100% stable; sizing was not. Sizes 5–8% of NAV → $26.4m to $42.2m of P&L on the same call. If your risk committee approved “the prompt,” it approved a $15.84m spread nobody quantified. Evidence: A1.
3. Ticker leakage. The model’s numeric estimate anchors on the security’s identity, not the disclosed facts. Change the letterhead, keep every digit, and the forecast falls 81.4%. Every pipeline eventually mismaps a symbol — and where a deterministic model gives you a wrong-but-diagnosable answer, an LLM silently re-prices the whole fundamental picture to fit the wrong name, at 89.9 confidence. Evidence: A3.
4. Confidence is a register of English, not a probability. 96.1 for a company that has never existed against 96.5 for the real collapse. A 0.4-point gap. Any design that sizes off confidence is sizing off writing style. Evidence: A5 vs A1.
5. Requested abstention doesn’t happen. The prompt said, explicitly, return NO_TRADE if you cannot identify the security. Zero of 60 runs did, on a fictional ticker. Worse, abstention fires inconsistently on real input — 12 of 60 in A3, on identical facts. Evidence: A5, A3.
6. Magnitude comes from prose, not arithmetic. Strip the narrative, keep every number, and the forecast collapses 59%. The model is a reader of stories containing numbers, not a calculator given prose. Fine for summarisation; disqualifying for sizing. Evidence: A6.
7. Tight clusters are recall, not analysis. Anonymise the company and the standard deviation of the magnitude estimate goes from 1.95 to 5.08 — 2.6× wider. The precision in A1 was memory of the outcome, not reasoning about the disclosure. Evidence: A2 vs A1.
8. Structured output launders the noise. {"confidence": 96, "position_size_pct": 7} validates against a schema and lands in a database column. Nothing downstream records that the same call would have said 6. JSON makes a sample look like a measurement.
9. There’s no temperature dial to hide behind. The endpoint I used exposes none — and most people calling models through an agent framework or a managed wrapper have no idea what’s set upstream. Even at temperature 0, batching and floating-point non-associativity on GPUs mean identical inputs are not guaranteed identical outputs. And pitfalls 3–6 aren’t sampling effects at all: temperature 0 makes them perfectly repeatable rather than absent.
Two models that explain the whole pattern
Precision vs accuracy (metrology). Accuracy is closeness to the true value; precision is closeness of readings to each other. They’re independent. A rifle clustering every shot two feet left of the bullseye is precise and inaccurate. My model’s mean was −23.55% against a true −26.4% — accurate. Its individual readings ran −20% to −25% with sizes 5–8% — imprecise. Trading doesn’t let you take the average. You place one order.
The picture: a bathroom scale showing 78.4kg, 81.1kg and 79.6kg on three consecutive steps. The decimal place isn’t information. It’s display resolution finer than the instrument’s repeatability. "confidence": 96 is that decimal place.
Ergodicity. A system is ergodic when the average across many parallel runs equals the average of one run over time. Trading isn’t. My ensemble mean was comfortingly close to the truth; you don’t get the ensemble. You get one draw. So “we tested the prompt and it works” isn’t evidence — it’s one path. The question is the distribution, and the worst draw you can survive.
What is the model actually doing?
You cannot fix this without understanding the mechanism. Four things are happening inside that call, and every pitfall above maps to one of them.
1. It is completing text, not computing an answer. The model predicts the next token given everything before it, then the next, conditioned on its own output. "target_1d_move_pct": -23 is not the result of a calculation that finished; it is the most plausible continuation of a document that begins with a bad earnings print and the token -2. Worked example: once it has emitted -2, the tokens 3, 4 and 5 are all high-probability continuations and 0 is not. That branch — taken in the first two tokens of a five-token number — is most of my A1 dispersion. The magnitude is decided before any “reasoning” about the guidance gap has finished.
2. Sampling is the default, and it’s not a bug. At each step the model has a probability distribution over the next token and draws from it. That’s what makes it fluent. Two tokens at 51/49 produce two different trades from identical input, and neither response knows the other existed. Worked example: in A1, SELL 5% and SELL 8% are both perfectly reasonable readings of the same print. The model isn’t wrong twice. It is right across a range, and the interface forces it to pick one point and print it without an error bar.
3. The ticker is a dense prior, and it’s in the prompt. “Meta Platforms (Nasdaq: FB), 2 February 2022” is one of the highest-signal token sequences about a price move in the entire training corpus. The disclosed facts are ordinary; the identity is not. So the identity dominates. Worked example: A3 keeps every digit and swaps in GOOGL, whose learned association is a stately compounder that doesn’t gap. Forecast: −4.4%. The facts contributed the sign; the name contributed the size.
4. confidence is generated the same way as prose. It’s not read off a calibrated posterior — the model has no access to one. It’s the number that most plausibly follows a decisive-sounding analyst paragraph. Worked example: A5’s paragraph about Vantiro Dynamics reads exactly like a confident analyst note, so the completion is 96, exactly as it is for the real Meta note. The model isn’t lying. It was never measuring uncertainty; it was matching a genre.
The design consequence: you must stop asking the model for things it structurally cannot produce — a point estimate, a calibrated confidence, a decision to abstain — and instead compute those yourself from many samples of what it can produce. That’s the skill.
From flawed prompt to working system: five steps
Each step fixes one measured failure. Full prompts throughout.
Step 1 — Kill the ticker leakage: anonymise at the boundary
The flaw: the identity does the work (pitfall 3).
The fix: the model never sees the name. Substitute a peer-group descriptor before the call and re-attach the identity afterwards.
Security: {peer_descriptor}. Report date withheld.with peer_descriptor = “a large-cap US social-media and digital-advertising company”. Keep the mapping outside the prompt. Direction survives (A2: 60/60 SELL). What you lose is a magnitude estimate that was memory anyway.
Test it, every prompt change and every model upgrade:
def leakage_test(call, item, entity_field="security"):
    """Robert Wood's prism, in code. Same facts, three identities."""
    named   = call(item)
    anon    = call({**item, entity_field: "a large-cap US listed company"})
    swapped = call({**item, entity_field: "Alphabet Inc. (Nasdaq: GOOGL)"})
    base = abs(named["target_1d_move_pct"]) or 1e-9
    att = 1 - abs(swapped["target_1d_move_pct"]) / base
    return {"attenuation_vs_swapped": att, "leaks": abs(att) > 0.25}
My A1/A3 pair: 0.814. Anything above ~0.25 means the identity is doing the work. Make it a CI gate.
Step 2 — Stop asking for a point estimate. Ask for bounded, ordinal judgements.
The flaw: the model emits a five-token float it cannot compute (pitfalls 1, 6).
The fix: ask only for things a text model can genuinely do — classify, rank, extract, bound. Never for a number that must be arithmetically correct.
Prompt v2, verbatim:
You are an equity analyst reading one quarterly disclosure. You are NOT deciding a trade.
Using ONLY the facts in the item, produce a structured reading.

Rules:
- Do not name, guess, or infer the identity of the company. If you believe you recognise it,
  ignore that belief and reason only from the facts given.
- Do not output any price, price target, percentage move, or position size.
- For each field, quote the exact fact from the item that drives your answer. If no fact in
  the item supports a field, output "insufficient" for that field. Never fill a gap from
  general knowledge.
- Judge severity relative to the consensus figures stated in the item, not to your priors.

Return:
  guidance_vs_consensus: one of {far_below, below, in_line, above, far_above}
  guidance_evidence:     verbatim quote from the item
  engagement_trend:      one of {deteriorating, flat, improving, insufficient}
  engagement_evidence:   verbatim quote
  margin_trend:          one of {deteriorating, flat, improving, insufficient}
  margin_evidence:       verbatim quote
  disclosed_headwind:    one of {none, moderate, severe, insufficient}
  headwind_evidence:     verbatim quote
  surprise_direction:    one of {negative, mixed, positive}
  unsupported_fields:    list of any field above you could not ground in a quote
Two things this buys. Five-way ordinal buckets are far more stable across samples than a float. And evidence-quoting is a cheap hallucination detector: if the quote isn’t a substring of the item, reject the whole response programmatically.
But if it’s just a completion engine, how can it produce a reliable ordinal?
This is the right objection, and the answer is the crux of the whole design. Four reasons, and the fourth is the one that actually matters.
1. An ordinal is one token; a float is five. far_below is a single choice from a five-element set. -23.55 is a sequence: sign, 2, 3, ., 5, 5 — and each position is an independent sampling event where a plausible alternative exists. Worked example: at the token after -2, the continuations 3, 4 and 5 all carry real probability mass, so the model can produce −23, −24 or −25 with no change of view. With far_below, there is exactly one decision point. You have cut the number of dice rolls from five to one, and that alone explains most of the stability gain.
2. The alternatives are semantically distant, so the probability mass concentrates. The model’s next-token distribution over {far_below, below, in_line, above, far_above} is not a coin flip. Given $27-29bn versus consensus $30.15bn, the mass sits overwhelmingly on far_below and below; above is essentially zero. Contrast the float case, where −23 and −24 are near-indistinguishable in meaning and therefore near-equal in probability. Ranking is easier than measuring for a text model, because ranking is what the training objective rewards — predicting which word comes next is fundamentally a comparison, not a computation.
3. You can constrain the decode. With a JSON-schema enum, the sampler is restricted to the permitted tokens: probabilities are renormalised over five options and nothing else can be emitted. It becomes structurally impossible to return slightly_below or a number. You have turned free generation into a five-way classification with a softmax over labels. Some providers will also return the log-probabilities of those options, in which case you get a genuine distribution over categories for free — which is what confidence was pretending to be all along.
4. And you verify it empirically rather than trusting the argument. Everything above is theory. The stability gate in the skill is the measurement: 50 samples, and every ordinal field must return the same modal value at least 95% of the time. If the ordinal is unstable, the gate fails and the prompt doesn’t deploy. That is the actual guarantee. Reasons 1–3 explain why the gate usually passes; the gate is what lets you rely on it.
And note the honest limit: stability is not correctness. A model can be 100% consistent and consistently wrong — which is exactly why the leakage, blind and fiction gates run alongside it, and why the deterministic scoring function in Step 3, not the model, decides what an ordinal is worth.
Step 3 — Compute the number yourself
The flaw: you needed the model to do arithmetic (pitfall 6, mechanism 1).
The fix: the LLM converts unstructured disclosure into structured features. A deterministic function turns features into a trade. That function is auditable, testable, versionable, and fires the same way every time.
SEVERITY = {"far_below": 3, "below": 2, "in_line": 0, "above": -2, "far_above": -3}
TREND    = {"deteriorating": 1, "flat": 0, "improving": -1, "insufficient": 0}
HEADWIND = {"severe": 2, "moderate": 1, "none": 0, "insufficient": 0}

def score(reading):
    return (SEVERITY[reading["guidance_vs_consensus"]]
            + TREND[reading["engagement_trend"]]
            + TREND[reading["margin_trend"]]
            + HEADWIND[reading["disclosed_headwind"]])

def to_trade(score_value, vol_20d, nav, risk_budget_bps=25):
    """Sizing is volatility-scaled and deterministic. The model never sees NAV."""
    if abs(score_value) < 3:
        return {"action": "NO_TRADE", "size_pct": 0.0}
    direction = "SELL" if score_value > 0 else "BUY"
    size_pct = min(2.0, (risk_budget_bps / 1e4) / max(vol_20d, 1e-6) * 100)
    return {"action": direction, "size_pct": round(size_pct, 2), "score": score_value}
Note what moved. Position size is now a function of realised volatility and a risk budget — not of a language model’s aesthetic sense. The A1 spread of 5–8% of NAV disappears because the model is no longer allowed near it.
Step 4 — Engineer abstention from measured disagreement
The flaw: asking for NO_TRADE doesn’t produce it (pitfall 5).
The fix: abstention is a property of the system, computed from how much the samples disagree, never from the model’s self-report.
import statistics as st
from collections import Counter

def ensemble_reading(call, item, n=15, quorum=0.80):
    runs = [call(item) for _ in range(n)]
    runs = [r for r in runs if evidence_grounded(r, item)]   # Step 2's substring check
    if len(runs) < n * 0.7:
        return {"action": "NO_TRADE", "reason": "too many ungrounded responses"}

    fields = ["guidance_vs_consensus", "engagement_trend", "margin_trend", "disclosed_headwind"]
    consensus, agreement = {}, {}
    for f in fields:
        c = Counter(r[f] for r in runs)
        val, k = c.most_common(1)[0]
        consensus[f], agreement[f] = val, k / len(runs)

    weakest = min(agreement, key=agreement.get)
    if agreement[weakest] < quorum:
        return {"action": "NO_TRADE",
                "reason": f"{weakest} agreement {agreement[weakest]:.0%} < {quorum:.0%}"}
    return {"reading": consensus, "min_agreement": agreement[weakest]}
The abstention rate becomes an observable you can chart, alert on, and show a regulator. Rising disagreement on a live feed is an early warning that your inputs have drifted — free monitoring you get nowhere else.
Step 5 — Freeze the artefact before it touches an order
The flaw: you cannot reproduce yesterday’s signal (pitfall 8, and every audit obligation).
The fix: content-addressed inference. The filename is a hash of every input.
import hashlib, json, pathlib
CACHE = pathlib.Path("/artefacts/llm")

def frozen(call, item, prompt_version, model_id, as_of):
    key = hashlib.sha256(json.dumps(
        {"item": item, "prompt": prompt_version, "model": model_id,
         "as_of": as_of.isoformat()}, sort_keys=True).encode()).hexdigest()
    path = CACHE / f"{key}.json"
    if path.exists():
        return json.loads(path.read_text())          # deterministic replay
    out = ensemble_reading(call, item)
    path.write_text(json.dumps({"key": key, "model": model_id,
                                "prompt": prompt_version,
                                "as_of": as_of.isoformat(), "result": out},
                               sort_keys=True))
    return out
Change one character of the prompt, or the model version, and you get a new key and a fresh call — a silent model upgrade can never quietly rewrite yesterday’s signal. Re-run the backtest in 2029 and you get byte-identical results.
This is the distinction that matters: non-determinism (the model gives different answers) versus irreproducibility (you can’t get the old answer back). You cannot eliminate the first. You must eliminate the second.
Does the skill need financial background knowledge?
Partly — and getting the split right is the difference between a skill that works and one that reintroduces every pitfall above.
What you must NOT put in the skill: narrative finance knowledge. No “social-media companies with decelerating engagement typically de-rate 20–30%.” No sector playbooks, no historical analogues, no “how the market usually reacts to a guide-down.” Every line of that kind is a prior, and a prior is what A3 measured: the model already has an enormous amount of this from pretraining, and it’s precisely what made a relabelled header worth 81.4% of the forecast. Writing sector lore into the prompt makes the leakage worse and harder to detect, because now it’s in your prompt as well as the weights. The skill’s Rule 2 exists to suppress this knowledge, not to supply more of it.
What the model already has, and you don’t need to teach: the semantics. It knows without being told that guidance below consensus is bad news, that margin contraction is worse than margin expansion, that a first-ever sequential decline in a core engagement metric is a structural signal rather than noise. This is genuine, useful, pretrained competence and Arm A4 confirms it — flip the numbers to a real beat and it switches to BUY 59 out of 60. Don’t spend prompt tokens re-teaching what “consensus” means.
What you absolutely must supply, because the model does not have it and will invent it: calibration thresholds. “Far below consensus” is not a fact about the world; it’s a firm-specific convention. Left undefined, the model fills the gap from vibes — differently on different runs — and your ordinal stability collapses for a reason that has nothing to do with the disclosure.
The teaser, and it’s the whole argument in one example. Guidance of $27–29bn against $30.15bn consensus. Ask the model whether that is below or far_below with no rubric, and you are asking for an aesthetic judgement; across 15 samples you will get both, and your quorum gate will refuse to trade a print that any analyst would call catastrophic. Now supply one line — “far_below = guidance midpoint at least 5% below consensus” — and the same question becomes arithmetic the model merely has to read: midpoint $28bn, consensus $30.15bn, gap 7.1%, therefore far_below. Same model, same facts, and the field goes from coin-flip to near-deterministic, because you replaced a judgement with a threshold.
So the rubric goes in the skill, as a table, with worked arithmetic:
| Field | Rule (deterministic, no judgement) | Meta Q4 2021 worked example |
|---|---|---|
guidance_vs_consensus | far_below ≤ −5%; below −5% to −1.5%; in_line ±1.5%; above +1.5% to +5%; far_above ≥ +5% — measured on guidance midpoint vs stated consensus | midpoint $28bn vs $30.15bn = −7.1% → far_below |
margin_trend | deteriorating if year-on-year contraction ≥ 150bps; flat within ±150bps; improving if expansion ≥ 150bps | 37% vs 46% = −900bps → deteriorating |
engagement_trend | deteriorating if the primary engagement metric declines sequentially, regardless of the year-on-year figure; otherwise on the sequential direction | first-ever sequential DAU decline → deteriorating (the +5% YoY is a distractor) |
disclosed_headwind | severe if a quantified headwind ≥ 3% of trailing-12-month revenue; moderate 1–3%; none below 1% or unquantified | $10bn vs $117.929bn FY2021 revenue = 8.5% → severe |
Four lines of arithmetic. Auditable, versionable, testable, identical every time — and crucially, each threshold is a business decision your risk committee can argue about and sign off, which is not true of a number a model produced because it felt right. Note the engagement rule: it encodes a judgement I hold and the model does not reliably share, that a first sequential decline outranks a healthy annual comparison. That is where your actual edge lives — in the rubric, not the prompt.
The general principle: put semantics in the model, thresholds in the skill, and arithmetic in the code. Every time you find yourself writing market knowledge into a prompt, ask whether it belongs in the deterministic layer instead. It almost always does.
The full skill
Here is the whole thing as a portable skill file. Drop it into Claude Code, Cursor, or your own agent runtime.
---
name: equity-event-reading
description: Convert a single quarterly disclosure into a structured, evidence-grounded
  reading that a deterministic sizing function can consume. Use for earnings, guidance
  updates, and pre-announcements. NEVER use to produce a price target, a position size,
  or a trade decision.
---

# Equity Event Reading

## What this skill does
Turns unstructured disclosure text into ordinal, evidence-quoted features.
It does not decide trades. Sizing and execution are handled downstream by
`sizing.to_trade()`, which is deterministic and separately tested.

## Hard constraints
1. NEVER output a price, price target, percentage move, or position size.
2. NEVER name or infer the issuer. Inputs arrive anonymised; if you recognise
   the company, ignore that recognition and reason only from the supplied facts.
3. EVERY field must be grounded in a verbatim quote from the item. If no fact
   supports a field, output "insufficient". Never fill a gap from prior knowledge.
4. Judge severity against the consensus figures stated in the item, never against priors.
5. Output valid JSON matching the schema. No commentary outside the JSON.

## Procedure
1. Read the item once end to end.
2. For each field, locate the single sentence that most directly bears on it.
3. Copy that sentence verbatim into the matching `*_evidence` field.
4. Apply the calibration rubric below. Do not substitute your own sense of severity.
5. List in `unsupported_fields` anything you could not ground.

## Calibration rubric (thresholds are firm policy, not your judgement)

guidance_vs_consensus  — on guidance MIDPOINT vs the consensus stated in the item:
    far_below  <= -5.0%
    below      -5.0% to -1.5%
    in_line    within +/-1.5%
    above      +1.5% to +5.0%
    far_above  >= +5.0%
  If no consensus figure is stated in the item, output "insufficient".

margin_trend — on operating margin vs the prior-year period:
    deteriorating  contraction >= 150bps
    flat           within +/-150bps
    improving      expansion >= 150bps

engagement_trend — on the primary engagement or volume metric:
    deteriorating  ANY sequential decline, regardless of the year-on-year figure
    improving      sequential increase
    flat           sequentially unchanged
  A healthy year-on-year comparison does NOT override a sequential decline.

disclosed_headwind — quantified forward headwind as a share of trailing
  twelve-month revenue stated in the item:
    severe    >= 3%
    moderate  1% to 3%
    none      < 1%, or the headwind is not quantified

surprise_direction — negative if EPS missed OR guidance is below/far_below;
  positive if EPS beat AND guidance is above/far_above; otherwise mixed.

## Worked example (reference case, for gate testing)
Item states: guidance $27-29bn vs consensus $30.15bn; operating margin 37% vs 46%;
primary metric up 5% year on year but down sequentially for the first time;
quantified headwind ~$10bn against trailing revenue $117.9bn.
Correct reading:
  guidance_vs_consensus = far_below   (midpoint 28.0 vs 30.15 = -7.1%)
  margin_trend          = deteriorating (-900bps)
  engagement_trend      = deteriorating (sequential decline outranks +5% YoY)
  disclosed_headwind    = severe        (10.0 / 117.9 = 8.5%)
  surprise_direction    = negative

## Schema
{
  "guidance_vs_consensus": "far_below|below|in_line|above|far_above",
  "guidance_evidence":     "string",
  "engagement_trend":      "deteriorating|flat|improving|insufficient",
  "engagement_evidence":   "string",
  "margin_trend":          "deteriorating|flat|improving|insufficient",
  "margin_evidence":       "string",
  "disclosed_headwind":    "none|moderate|severe|insufficient",
  "headwind_evidence":     "string",
  "surprise_direction":    "negative|mixed|positive",
  "unsupported_fields":    ["string"]
}

## Calling contract (enforced by the harness, not by you)
- n = 15 independent samples per item; the caller takes the modal value per field.
- Any response whose *_evidence is not a substring of the item is discarded.
- If per-field agreement across surviving samples is below 80%, the caller
  returns NO_TRADE and no order is generated.
- The accepted reading is written to a content-addressed artefact keyed on
  (item, prompt version, model id, as-of date) and is immutable.

## Pre-deployment gates (all must pass)
- Leakage: relabel the item's issuer; no ordinal field may change. Fail => do not deploy.
- Blind: run with the issuer anonymised; results must match the named run.
- Fiction: run against a fabricated issuer with fabricated figures; the harness must
  return NO_TRADE via the agreement gate. (The model will not abstain on its own.)
- Stability: 50 samples; per-field modal share >= 0.95 on the reference set.
- Reproducibility: re-running a frozen key returns byte-identical output.

## Escalate to a human when
- Agreement is 60-80% on any field (borderline, not clearly abstain).
- unsupported_fields is non-empty on more than 20% of samples.
- The disclosure contains a restatement, going-concern language, or an auditor change.
And the runner, end to end:
def signal_for_event(raw_item, security_id, vol_20d, nav, as_of,
                     prompt_version="v4", model_id="frozen-2026-08"):
    anon = anonymise(raw_item, security_id)              # Step 1
    reading = frozen(call_skill, anon, prompt_version,   # Steps 2, 4, 5
                     model_id, as_of)
    if reading.get("action") == "NO_TRADE":
        return reading
    trade = to_trade(score(reading["reading"]), vol_20d, nav)   # Step 3
    return {**trade, "security_id": security_id,                # identity re-attached
            "artefact_key": reading["key"],
            "min_agreement": reading["min_agreement"]}
What changed, measured against the original: position size is deterministic given volatility (was 5–8% of NAV on identical input); the issuer’s identity cannot influence the estimate (was an 81.4% swing); abstention is computed rather than requested (was 0 of 60); every output is replayable from a hash (was irreproducible); and the model’s self-reported confidence has been deleted from the pipeline entirely (was 96.1 on a fictional company).
What you give up: the demo. There is no screenshot of a model calling a −26% crash. There is a boring SELL, 1.4% of NAV, agreement 93%, artefact 8f3c…. That is the trade-off, and it’s the right one.
What stays out of the loop entirely
| Decision | Why |
|---|---|
| Gross and net exposure limits | An 89.2% disagreement rate cannot hold a mandate |
| The kill switch | Must work when the model is unavailable |
| Sizing at execution | A1: 5% to 8% of NAV on identical input |
| Whether an instrument is tradeable | A5: zero abstentions on a company that doesn’t exist |
| Anything a regulator will ask you to reproduce | See below |
The compliance point, precisely
Two corrections first, because both are widely misstated. Trading is not “high risk” under the EU AI Act — Annex III lists creditworthiness scoring and life/health insurance pricing, not algorithmic trading (Annex III). And no regulator has mandated a human in the LLM loop: FINRA’s RN 24-09 restates that existing rules apply, MAS’s AI Model Risk Management paper is supervisory guidance, and its July 2026 SAFR initiative is explicitly non-binding.
The real constraint is narrower and my data walks straight into it. MiFID II RTS 6 (Reg. (EU) 2017/589) requires firms to test algorithms before deployment and confirm they behave as intended (Art. 5), conformance-test against the venue (Art. 6), maintain a separated test environment (Art. 7), self-assess annually (Art. 9), and keep kill functionality (Art. 12) and pre-trade controls (Art. 15).
A conformance test is structurally a determinism test: you assert that given input X the algorithm does Y, and demonstrate it. A component returning 13 different trades to one input has no Y — you cannot write the assertion. This isn’t a regulator disliking AI; it’s an evidentiary requirement a sampler cannot meet. Which is exactly why Step 5 is the compliance answer as well as the engineering one: you certify the frozen artefact, which is deterministic, and the model sits upstream of the regulated perimeter.
The same logic runs through SEC Rule 15c3-5, which requires risk-management controls under the broker-dealer’s “direct and exclusive control” (17 CFR 240.15c3-5).
And note where enforcement has actually landed: Delphia ($225,000), Global Predictions ($175,000), Rimar Capital ($310,000 in penalties plus $213,611 disgorgement) — all AI-washing cases, misrepresenting what the AI did (SEC, SEC). The demonstrated legal risk is describing your system inaccurately. Which makes dispersion data not just an engineering artefact but the evidence base for describing it honestly.
A prediction
By 31 December 2027, at least one major regulator — MAS or the FCA first, I expect — will publish supervisory expectations requiring firms to evidence the output stability of a non-deterministic model component, not merely its accuracy. Wording along the lines of “demonstrate reproducibility of model outputs under identical inputs.” Firms logging only the accepted response will find they cannot produce that evidence retrospectively, because they never sampled. Start logging n-sample dispersion alongside every LLM-derived field today.
The takeaway
The industry is arguing about whether language models can predict returns. Wrong argument. Mine predicted the largest single-day wipeout in US market history, 60 times out of 60, and I still wouldn’t let it size a position.
A prompt is not a strategy. It’s a sampler. Sample it, measure its dispersion, gate on stability, engineer the abstention, freeze the artefact, and keep it upstream of anything that can send an order.
And before you trust any of it — remove the prism. Run 50 samples of a prompt you already trust in production and tell me the standard deviation of the position size. I’ll publish the distribution of what people find, anonymised. I suspect almost nobody has looked.
FAQ
Are LLMs useless in trading? No. They’re build-time instruments. Extracting supplier relationships from 8-Ks, normalising filings, drafting and reviewing research code, turning transcripts into structured fields — all excellent, all producing artefacts you freeze, test and version. The boundary is the order path.
Would a reasoning model fix it? It narrows the sampling dispersion — that’s now measured, not speculated: Claude Sonnet 5 cut pairwise disagreement from 89.2% to 45.9% and sizing SD from 1.01 to 0.31. It did not touch fictional-company confidence, which comes from what was learned rather than how it decodes. Test any candidate with the leakage and fiction probes, not a demo.
Why isn’t the base model named? Because I cannot prove which one it was. The endpoint doesn’t say. I’d rather publish that limitation and replicate on two pinned models than assert an identity I can’t evidence — and the fact that a mainstream inference path makes model identity unauditable is a finding in its own right, not a footnote.
Is 60 runs enough? For the dispersion claims, comfortably; the effects are large. For 96.5 versus 96.1 I claim only that the difference is negligible, which small samples support.
How is this different from look-ahead bias? Look-ahead is about the model knowing the answer — covered here. This persists when there is no answer to know: A5 has no ground truth at all and still produced 15 distinct trades.
I’m Jiri Pik, founder of RocketEdge, an AI cloud architect and quant trader in Singapore, and co-author of “Hands-On AI Trading with Python, QuantConnect, and AWS” and “Hands-On Financial Trading with Python.”
This post describes a measurement of model behaviour. It is not investment advice, nor a recommendation regarding any security. Meta Platforms and Alphabet appear solely as documented historical examples. “Vantiro Dynamics Holdings plc” is fictional. Nothing here promises any financial return. P&L figures are illustrative arithmetic on a historical price move, excluding fees, financing, borrow, slippage and market impact. No proprietary RocketEdge data appears in this post.