
TL;DR: A viral LinkedIn post claimed a frontier LLM recreated Renaissance Technologies’ Medallion Fund — 66% annualized for three decades — from the single prompt “make medallion fund”. I took the joke literally, built the strategy it implies, and backtested it: $1 turned into $0.02 net of costs. The lesson isn’t that LLMs are useless for trading. It’s that alpha lives in execution and data exclusivity, not in ideas — and the real edge LLMs give you is research velocity: 100+ rigorously tested hypotheses per quarter instead of ten.
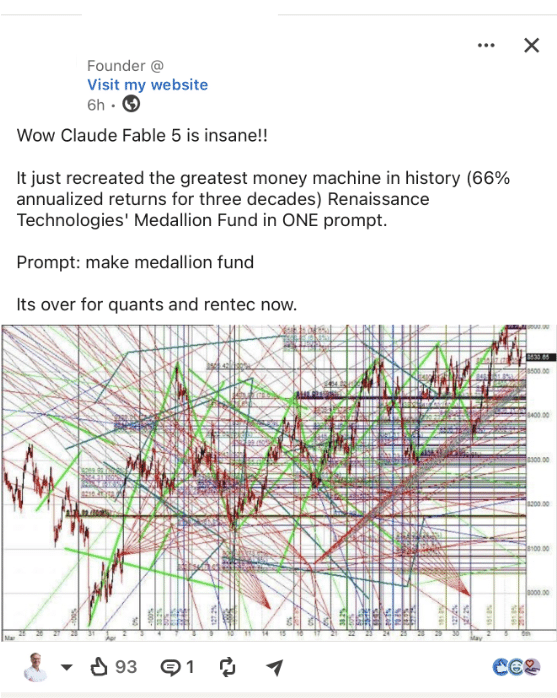
You’ve probably seen the post. A founder announces that “Claude Fable 5” just recreated the greatest money machine in history in ONE prompt. Attached is an equity chart buried under so many trendlines, channels, and Gann fans that the price action is barely visible. “It’s over for quants and rentec now.”
The chart is doing exactly what it looks like it’s doing: draw enough lines on a chart and, by sheer arithmetic, one of them will predict the future. It’s the stopped-clock school of quantitative finance — with that many lines, you’re guaranteed to be right at least twice a day. The genius part is that you get to pick which line to screenshot afterwards.
I’ve been building trading systems for two decades — most recently AI-driven ones at RocketEdge and in Hands-On AI Trading with Python, QuantConnect, and AWS. So instead of just laughing at the meme, I did what the post pretended to do: I took the prompt at face value, implemented the textbook strategy it implies, and measured what actually happens. The full analysis is in the research report embedded below. Spoiler: the meme is funny because it’s wrong, and the ways it’s wrong are far more instructive than the joke.
What Is the Medallion Fund, Actually?
Before dissecting the meme, it’s worth being precise about what it claims to replicate, because Medallion is the single most extreme data point in the history of investing.
Renaissance Technologies, founded by mathematician Jim Simons in 1982, launched the Medallion Fund in 1988. From 1988 to 2018, Medallion returned roughly 66% annualized before fees and 39% after fees — and the fees were themselves outrageous: 5% management and 44% performance, against the industry’s standard “2 and 20” (Wikipedia). UCLA’s Bradford Cornell calculated that $100 invested in Medallion in 1988 would have grown to $398.7 million by 2018 — versus about $1,910 for the same $100 in the broad US market (Cornell Capital).
It gets stranger. Over those 31 years, Medallion never had a negative year. It returned 56.6% through the dot-com crash and 74.6% through the 2008 financial crisis, and its market beta was approximately −1.0 — it hedged the market while crushing it (Cornell Capital). Cornell, a man who has read decades of anomaly literature, concluded the performance “stretches explanation to the limit” and called it “the ultimate counterexample to the hypothesis of market efficiency” (Institutional Investor).
How does Medallion actually trade?
The best public account remains Gregory Zuckerman’s The Man Who Solved the Market, and the picture it paints is nothing like a clever indicator on a chart:
- Thousands of weak signals, not one strong one. Medallion holds thousands of short-term long and short positions simultaneously, from high-frequency horizons up to one or two weeks (Institutional Investor).
- A hit rate barely above a coin flip. Robert Mercer reportedly put it at 50.75% — “but you can make billions that way” when you trade millions of times with disciplined, Kelly-style sizing (Institutional Investor).
- Data as the core asset. RenTec started collecting and cleaning tick-level and alternative data decades before “alternative data” was an industry (Quartr).
- Aggressive, cheap leverage. Zuckerman estimates average leverage around 12.5×, at times up to 20× — affordable only because the underlying return stream is so consistent (Quartr).
- Ruthless capacity discipline. The fund is capped around $10–15B, closed to outside money since 1993, and distributes profits every year to stay small (Quartr).
Notice what’s missing from that list: a secret indicator. Medallion’s edge is a stack of institutional assets — data, execution infrastructure, governance, people — compounded over decades. Keep that in mind for what comes next.
What Happens When You Actually Run the One-Prompt Strategy?
The prompt “make medallion fund” most plausibly yields the canonical textbook recipe every LLM has memorized: daily cross-sectional mean reversion — long yesterday’s losers, short yesterday’s winners, dollar-neutral, equal-weighted. So that’s what I tested: bottom-vs-top quintile of prior-day returns on 20 US large caps, January 2016 through June 2026, with a deliberately gentle 10 bps per side in transaction costs.
| Variant | CAGR | Sharpe | Max DD | Avg daily turnover |
|---|---|---|---|---|
| Gross (zero costs) | +2.15% | 0.24 | −25.6% | 151% of book |
| Net (10 bps/side) | −30.21% | −3.04 | −97.7% | 151% of book |
| Medallion reference | ~66%/yr gross | >2.0 | — | — |
Growth of $1 tells the story bluntly. At Medallion’s historical pace, $1 compounds to roughly $195 over the window. The one-prompt strategy decays to $0.02. Same “idea”, three different destinies — the full equity curves, methodology, and caveats are in the report embedded below.
The diagnosis is the entire lesson. The raw signal is roughly flat before costs — there’s almost no edge to begin with, because daily reversal in mega-caps has been arbitraged to dust. Then 151% daily turnover at 10 bps per side converts a flat line into a slow-motion liquidation. The LLM produced plausible, runnable code — and a portfolio that loses money with quiet determination.
And here’s the kicker: anything a public model can emit on demand is, by definition, not proprietary. The same model will hand the same “novel” strategy to every other desk that asks. The meme’s chart — one of those fifty lines must be the future — is just this failure mode drawn in crayon: infinite hypotheses, zero validation. I’ve written before about how easy it is to fool yourself with perfect-foresight backtests; this is the prompt-engineering edition.
Where Do LLMs Actually Make Money in Quant Research?
This is where I part ways with both camps — the “AGI will solve markets” crowd and the “LLMs are useless toys” crowd. The evidence base is now good enough to be specific.
Where LLMs genuinely add value:
- Signal extraction from text. Lopez-Lira and Tang showed that LLM sentiment scores on news headlines predict out-of-sample daily returns, strongest in small caps and after negative news (SSRN). The model adds value by reading the news, not by managing the money.
- Research velocity. A desk can generate and backtest 500 candidate strategies in about two hours — work that takes a human team weeks (StratCraft).
- Code generation and data cleaning. Documented in production at Man Group and Two Sigma (Resonanz Capital).
- Literature mining. Retrieval over decades of internal research archives is one of the leading adoption patterns at systematic funds (Resonanz Capital).
Where LLMs reliably fail:
- Autonomous trading. The FINSABER benchmark shows reported LLM trading advantages deteriorate badly under broader, longer evaluation — too conservative in bull markets, too aggressive in bears (arXiv).
- Novel alpha from memorized patterns. Strategies built from textbook indicators — MACD, RSI, the meme chart’s beloved trendlines — are the worst performers out-of-sample, because they’re the most data-snooped ideas in existence (StratCraft).
The synthesis: alpha comes from execution and data exclusivity, not from ideas. If a frontier model can articulate any strategy on demand, strategy ideas have a marginal cost approaching zero — and zero-cost goods carry no economic rent. The entire defensible edge migrates to the two things a model cannot emit in a code block: exclusive data and superior execution. That’s exactly the shape of Medallion’s moat, and it’s why the fund’s returns survived 30 years of competitors knowing roughly what it does.
But there’s a second, underrated edge: research velocity. In my experience — and the data agrees — roughly 15% of well-constructed strategy candidates survive realistic costs, whether a human or an LLM generated them. The LLM doesn’t improve your hit rate. It improves your throughput: 100+ properly validated hypotheses per quarter instead of ten. At a constant 15% survival rate, that’s 10× more validated signals in absolute terms. The edge isn’t a smarter idea; it’s an industrialized, well-governed idea factory — provided your validation pipeline (walk-forward testing, deflated Sharpe ratios, human review gates) keeps pace with generation. This is precisely the workflow I’m building into the platform at RocketEdge, and it rhymes with what I argued about AI amplifying human expertise in hedge funds: the model proposes; the desk disposes.
What I Think Comes Next
Three specific calls, revisit me on these in 18 months:
- By the end of 2027, “hypotheses tested per quarter” becomes a standard due-diligence question for systematic funds, the way “what’s your data budget?” became one a decade ago. AIMA already reports front-office GenAI adoption has shifted from “if” to “when” (AIMA).
- LLM-crowding becomes a measurable risk factor. When thousands of desks prompt the same handful of models, the models synchronize the herd into the same canonical trades. Expect the first academic paper quantifying “prompt crowding” decay within two years.
- Research budgets rebalance from idea generation toward execution and exclusive data. If ideas are free, paying senior quants to brainstorm is mis-allocation; paying for venue access, latency, and datasets nobody else has is not.
Alternative Perspectives
“The meme is directionally right — it’s just early.” A credible version of the bull case: models improve, agentic systems get execution access, and the cost advantage of an AI-only desk eventually overwhelms incumbent infrastructure. I don’t buy it for alpha generation — crowding gets worse as models improve, not better, because more desks receive the same ideas faster. But for the cost side of running a fund, the meme’s spirit may age well.
“Medallion proves nothing for the rest of us.” Cornell’s own conclusion is that Medallion has no rational market explanation — it’s a singular outlier, possibly unrepeatable under any technology regime (Cornell Capital). On this view, benchmarking anything against Medallion — human or machine — is a category error, and the honest comparison for LLM workflows is the median quant fund, against which the velocity argument is far more flattering.
FAQ
Did an LLM really recreate the Medallion Fund?
No. The viral post was satire — the chart was an overfitted mess of trendlines, and the model name was fictional. When I implemented the strategy the prompt actually implies and backtested it with realistic costs, $1 decayed to $0.02 over the test window.
What made the Medallion Fund so profitable?
A combination no prompt can replicate: decades of proprietary curated data, microstructure-aware execution, ~12.5× cheap leverage, strict capacity discipline (capped around $10–15B), and thousands of weak signals sized with Kelly-style discipline at a hit rate barely above 50% (Quartr, Institutional Investor).
Can LLMs be profitable in trading at all?
Yes — as inputs, not portfolio managers. Evidence supports LLM-derived sentiment signals, code generation, literature mining, and above all research velocity: testing 100+ hypotheses per quarter with rigorous validation. Autonomous LLM trading deteriorates badly under honest, long-horizon evaluation (arXiv).
Why do LLM-generated strategies fail in backtests?
The most common failure modes are data-snooped textbook patterns (MACD, RSI, trendlines), look-ahead and survivorship bias, and ignoring transaction costs. In my test, 151% daily turnover at just 10 bps per side turned a flat gross signal into a −97.7% drawdown.
What’s the “draw enough lines” fallacy?
If you overlay dozens of trendlines, channels, and fans on a chart, some will inevitably coincide with future price action by pure chance. Selecting the winning line after the fact is survivorship bias in its purest visual form — and it’s exactly how overfitted strategies are born, whether drawn by hand or generated at scale by a model.
Disclaimer: This reflects my personal views and experience, not financial advice. The backtest discussed is a deliberately naive toy model built for educational purposes. Past performance — including Medallion’s — doesn’t guarantee future results.
Jiri Pik is the founder of RocketEdge, an AI fintech company based in Singapore. Follow him on LinkedIn and X for more.