

This post is written in collaboration with Oquant, a next-generation real-time artificial intelligence company poised to take a leadership role in AI and quantitative finance. Oquant’s initial product is a fully automated trading platform built on a one-of-a-kind AI trading strategy called mBase.
1. Amazon DevOps Guru
Amazon DevOps Guru is a fully managed service designed to help developers improve performance and availability of their applications. The service monitors and analyzes your application’s operational data events and application metrics in real-time and identifies behavior which deviates from normal operating patterns. Such anomalous behavior is then assessed by DevOps Guru and the service then reports those detected to be an operational issue or risk as reactive insights, along with recommendations to address the problem. In addition, DevOps Guru offers proactive insights aimed at avoiding your application’s operational issues in the future.
The potential issues are identified as anomalies or outliers and when an issue occurs, DevOps Guru generates insights with a summary of related anomalies and contextual information about the issue and provides recommendations on how to address the issue. It leverages machine learning models to correlate and group related anomalies so that the number of repeated or false positive warnings is minimized.
1.1 Setting Up DevOps Guru
Setting up DevOps Guru involves two steps:
1.1.1 Step #1 – Define coverage
You can monitor
- all resources on an AWS account or
- selected CloudFormation stacks or
- only resources with selected AWS tags
Differentiating the coverage by a particular CloudFormation stack or tag helps DevOps Guru to differentiate one app from another (an app is a collection of resources that are monitored together in DevOps Guru). Organizing your resources in separate apps allows you to better monitor them within a boundary by spotting correlated anomalies across interdependent entities.
1.1.2 Step #2 – Define notifications
Specify one or two Amazon SNS topics for DevOps Guru’s notifications.
1.2 DevOps Guru Pricing
- $0.0028 per resource per hour for Lambda Functions and S3 Buckets.
- $0.0042 per resource per hour for all other covered resources.
For example, DevOps Guru’s monitoring of a single RDS will cost $3.024 (= 0.0042 * 24 * 30) per month.
1.3 DevOps Guru Value
The value of the service comprises these benefits:
- It frees developers’ time from constant monitoring of all key metrics since it reports only significant anomalies as they happen → fast root cause diagnosis.
- The service detects problems you might not have known about otherwise.
- It also helps provide recommendations on how to remediate the issue → fast resolution.
- For some services, such as AWS Lambda, it can even provide proactive insights of code refactoring hints. For more details, see this article.
2. Amazon DevOps Guru for RDS
Amazon DevOps Guru for RDS was introduced in December 2021.
The service supports Amazon Aurora engines with anomaly detection and detailed analysis and recommendations (with support for other RDS engines coming in future).
Amazon DevOps Guru for RDS builds upon the Amazon RDS Performance Insights’ concept of Database load. Database load is defined as the count of active sessions in a database, taken once a second. A session can be approximated by a connection and the word active indicates that the database is working on a request. Database load is a very accurate measure of how stressed a database is and of the database service quality.
Every database active session can be either running on the CPU or waiting. A database wait event occurs when the database is waiting for one of the database subsystems to execute a command. Each database technology has different names for the various wait events (see Aurora MySQL and Aurora PostgreSQL wait events). Each database engine has its own catalog of 100+ types of wait events.
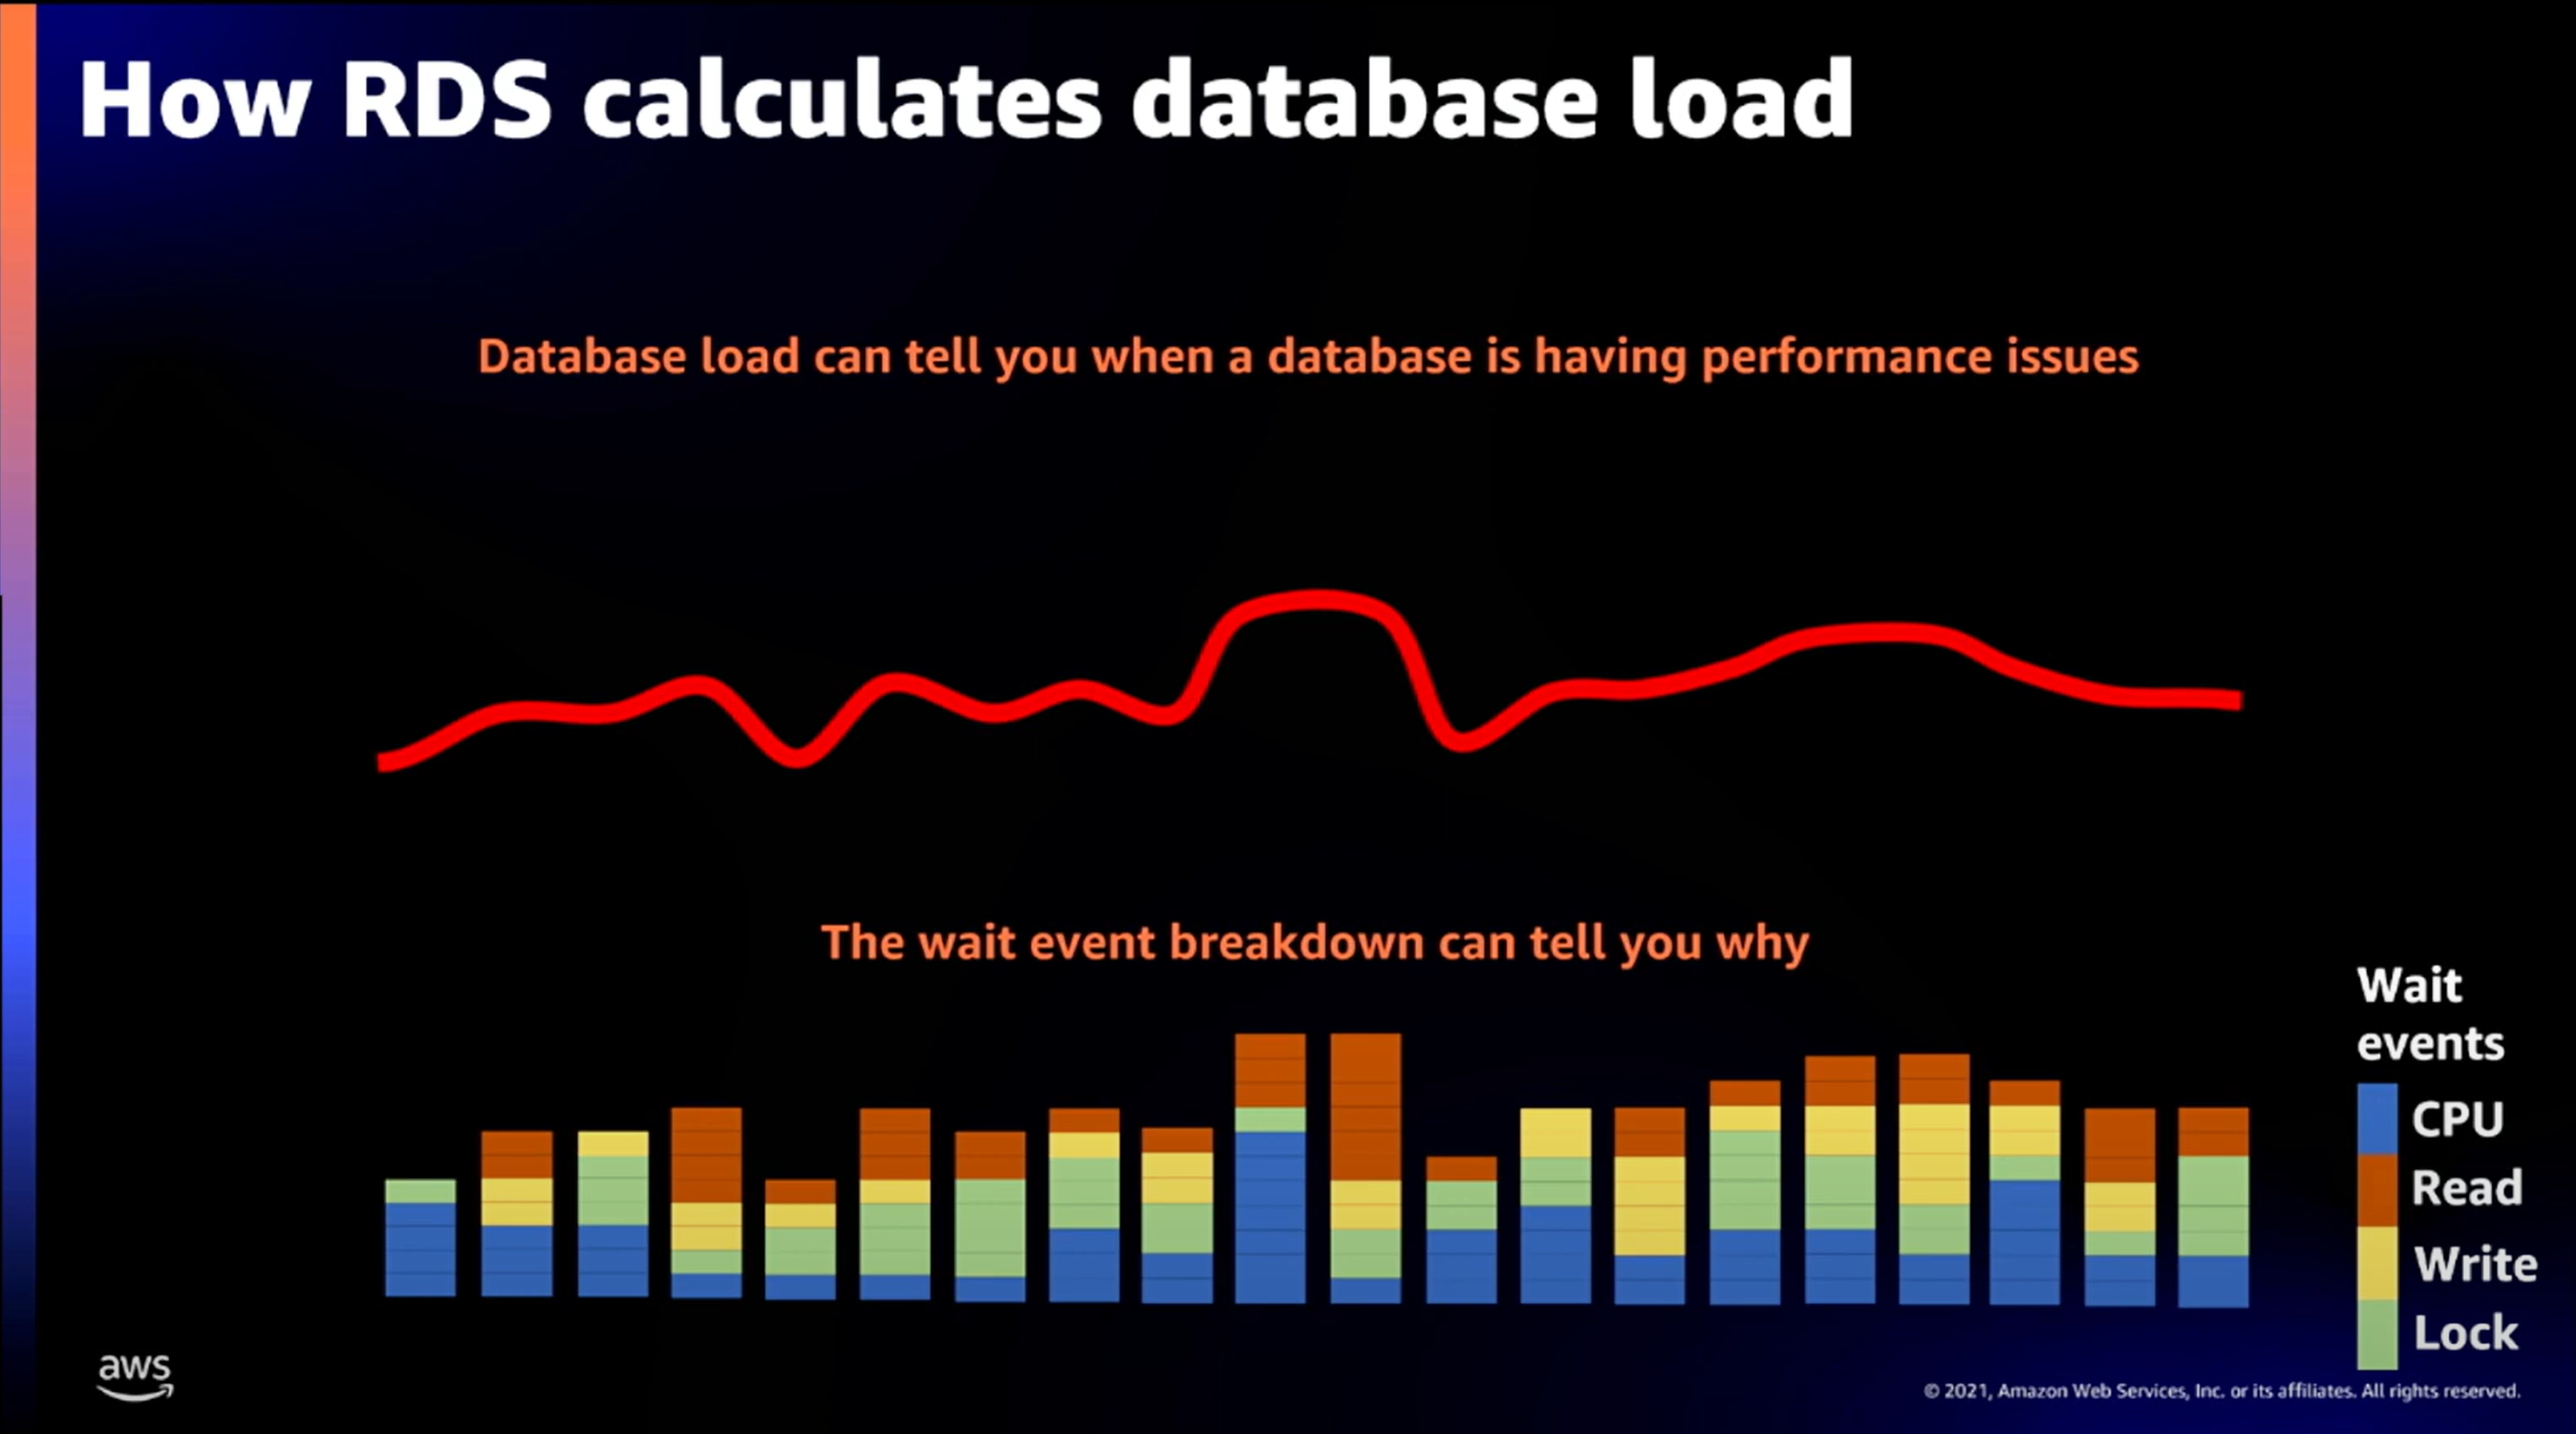
2.1 Database Load Example
For this example, let’s consider a database with only four wait events:
- CPU wait event
- READ wait event
- WRITE wait event
- LOCK wait event
The usefulness of database load can be summarized as follows:
- Database load can tell you when a database is having performance issues.
- The wait event breakdown of the database load can tell you why the database has performance issues.
2.2 Identification of an anomaly
DevOps Guru for RDS then monitors the Database Load metric for anomalies such that
- The anomaly occurs for a substantial amount of time.
- The anomaly has not been reported before, e.g., is not periodic (it filters out scheduled jobs).
- The anomaly causes significant performance impacts – i.e., the Database load is substantially higher than the number of vCPUs available.
When DevOps Guru for RDS finds an anomaly, it analyzes these factors:
- Most prevalent wait events, which are the likely ‘root causes’ of the observed problems
- The SQL statements affected from the wait events identified in (1)
- Other anomalous metrics – such as memory, I/O, number of connections.
DevOps Guru for RDS uses a set of rule-based algorithms for analysis, generates simple explanations for the dominating wait events, provides recommendations for the next steps, and publishes the findings as an SNS event along with relevant metadata. The developers then need to go through the identified SQL statements and associated wait events one by one and determine the exact cause of the anomaly using the troubleshooting documents that DevOps Guru for RDS links as reference.
Examples of anomalies identified by DevOps Guru for RDS:
- The high-load wait event is waiting for access to a table → most likely a database index is missing.
- The high-load wait event is a record lock → most likely multiple statements are accessing the same database row at the same time – “popular item”.
- The high-load wait event is IO:XactSync (PostgreSQL) → this event happens when the Aurora storage subsystem waits to acknowledge the commit of a regular transaction – the most likely cause is using default JDBC/ODBC driver’s settings of AutoCommit == True (this setting means that every single command has to sync data to disk which dramatically increases latency). AutoCommit == True setting can exhibit itself in a number of forms and is a frequent cause of performance problems.
The main performance anomaly that DevOps Guru for RDS identifies is based on DB load metric. However, in addition to the “main anomaly”, DevOps Guru for RDS also reports “contextual anomalies” which include high CPU, Memory, Number of Database Connections and similar statistics. These contextual anomalies provide additional relevant details that can help you troubleshoot the issue faster.
2.3 Determination of the Baseline for Anomalies
The key decision DevOps Guru for RDS makes is the determination of the baseline for all anomalies.
Prerequisites:
- The database must exist and have enabled RDS Performance Insights for about two days.
- DevOps Guru for RDS must be enabled on this database.
Once these prerequisites are met, it takes a few hours to establish the baseline and start generating findings. The baseline is based on up to the last 14 days of historical data (Notice: the mentioned number of days are subject to change).
2.4 Inside DevOps Guru for RDS
DevOps Guru for RDS relies on RDS Performance Insights to collect performance telemetry for a database e.g., database load and corresponding wait events.
For Aurora MySQL with enabled Performance Schema, it can show timed wait events. With disabled Performance Schema, it shows thread states instead of wait events which are not so precise.
For Aurora PostgreSQL, there is no Performance Schema, and all relevant metrics are provided natively from the database server.
3. Performance Optimization Insights from Using Amazon DevOps Guru for RDS
3.1 Insight #1 – Rightsizing
DevOps Guru for RDS identifies situations where:
- Database CPU is exhausted
- System Memory is exhausted
- Number of database connections spiked
If analysis of these reported anomalies shows that they are not anomalies, but part of standard operations, then the database instance must be upgraded.
3.2 Insight #2 – Fast diagnosis and fast resolution of performance and operational problems
DevOps Guru for RDS identifies operational and performance issues in real-time, provides all relevant information needed for troubleshooting and suggests avenues of investigation or corrective actions → you can resolve the issues more quickly than by troubleshooting manually.
3.3 Insight #3 – Rapid identification of anomalous queries
DevOps Guru for RDS associates each anomaly with the list of queries involved in the anomaly.
4. Illustration Example
Let’s simulate a DevOps Guru for RDS anomaly with a real-world example of locking of a record.
4.1 Step #01 – Create a database table and populate it with ten million random records with an increasing integer ID of 1 to 10,000,000
create table test1(id int, filler char(255), timer timestamp);The contents of the file ams_add_records.py:
#! /bin/env python3

import mysql.connector
import string
import random
import sys
import os

from datetime import datetime

# Example: ams_add_records.py test1 10000000 10000
# Add 10_000_000 records to 'test1' table, in batches of 10_000
table_name, table_size, batch_size = sys.argv[1], int(sys.argv[2]), int(sys.argv[3])

# Connect to the database
conn = mysql.connector.connect(
    user='admin',
    password='XXX',
    host='XXX.cluster-XXX.us-east-1.rds.amazonaws.com',
    database='sysbench',
    use_pure=False
)
cursor = conn.cursor()
cursor.autocommit = 0;

sql = f"insert into {table_name}(id, filler, timer) values(%(id)s, %(filler)s, %(timer)s)"

cursor.execute("set autocommit=0");

# Execute "add records" in batches
dvars = []
for i in range(table_size // batch_size):
    cursor.execute("start transaction")
    dvars = [
        {
            "filler": "".join(random.choice(string.ascii_lowercase) for _ in range(255)),
            "timer": datetime.now(),
            "id": i*batch_size +_ +1,
        } for _ in range(batch_size)
    ]
    cursor.executemany(sql, dvars)
    cursor.execute("commit")
    print(f"{datetime.now().strftime('%Y-%m-%d %H:%M:%S')}: {(i+1)*batch_size}")

cursor.execute("commit")

cursor.close()
conn.close()
With the command
python3 ams_add_records.py test1 10000000 100004.2 Step #02 – Create a database index on this table
create unique index test1_pk on test1(id);4.3 Step #03 – Add a locking record
insert into test1 values(-1, 'locker', current_timestamp);4.4 Step #04 – In the first database console window, open a database console and launch these commands
start transaction; update test1 set timer=current_timestamp() where id=-1;4.5 Step #05 – In the second window, launch the below Python script trying to update the same table’s record with id = -1 from an increasing number of threads
The content of the file ams_locking_scenario.py:
#! /bin/env python3

import mysql.connector
import string
import random
import os
import sys
import threading
import multiprocessing

from datetime import datetime
from time import time, sleep

# Example: ams_locking_scenario.py 1 1200 2
# Worker: 1
# Run for 1200 seconds (20 minutes)
# Add a new competing session every 2 seconds
session, max_seconds, delay_seconds = int(sys.argv[1]), int(sys.argv[2]), int(sys.argv[3])

def create_lock(timer):
    conn = mysql.connector.connect(
        user='admin',
        password='XXX',
        host='XXX.us-east-1.rds.amazonaws.com',
        database='sysbench',
        use_pure=False
    )

    cursor = conn.cursor()

    sql = "update test1 set timer=%(timer)s where id=-1"

    cursor.execute("set innodb_lock_wait_timeout=%(timeout)s", {"timeout": max_seconds+50})
    cursor.execute(sql, {"timer": datetime.now()})

    cursor.close()
    conn.close()


print(f"BEGIN: {session}")
i, threads, start_time = 0, [], time()
while True:
    if time() - start_time > max_seconds:
        break

    try:
        print(f"Session: {session}: starting thread: {i}")
        x = threading.Thread(target=create_lock, args=(datetime.now(),))
        threads.append(x)
        x.start()
        sleep(delay_seconds)
        i += 1

    except Exception as e:
        print(f"Session: {session} failed at: {i}: {e}")
        sleep(1)

print(f"END: {session}")
[_.join() for _ in threads]
With the command
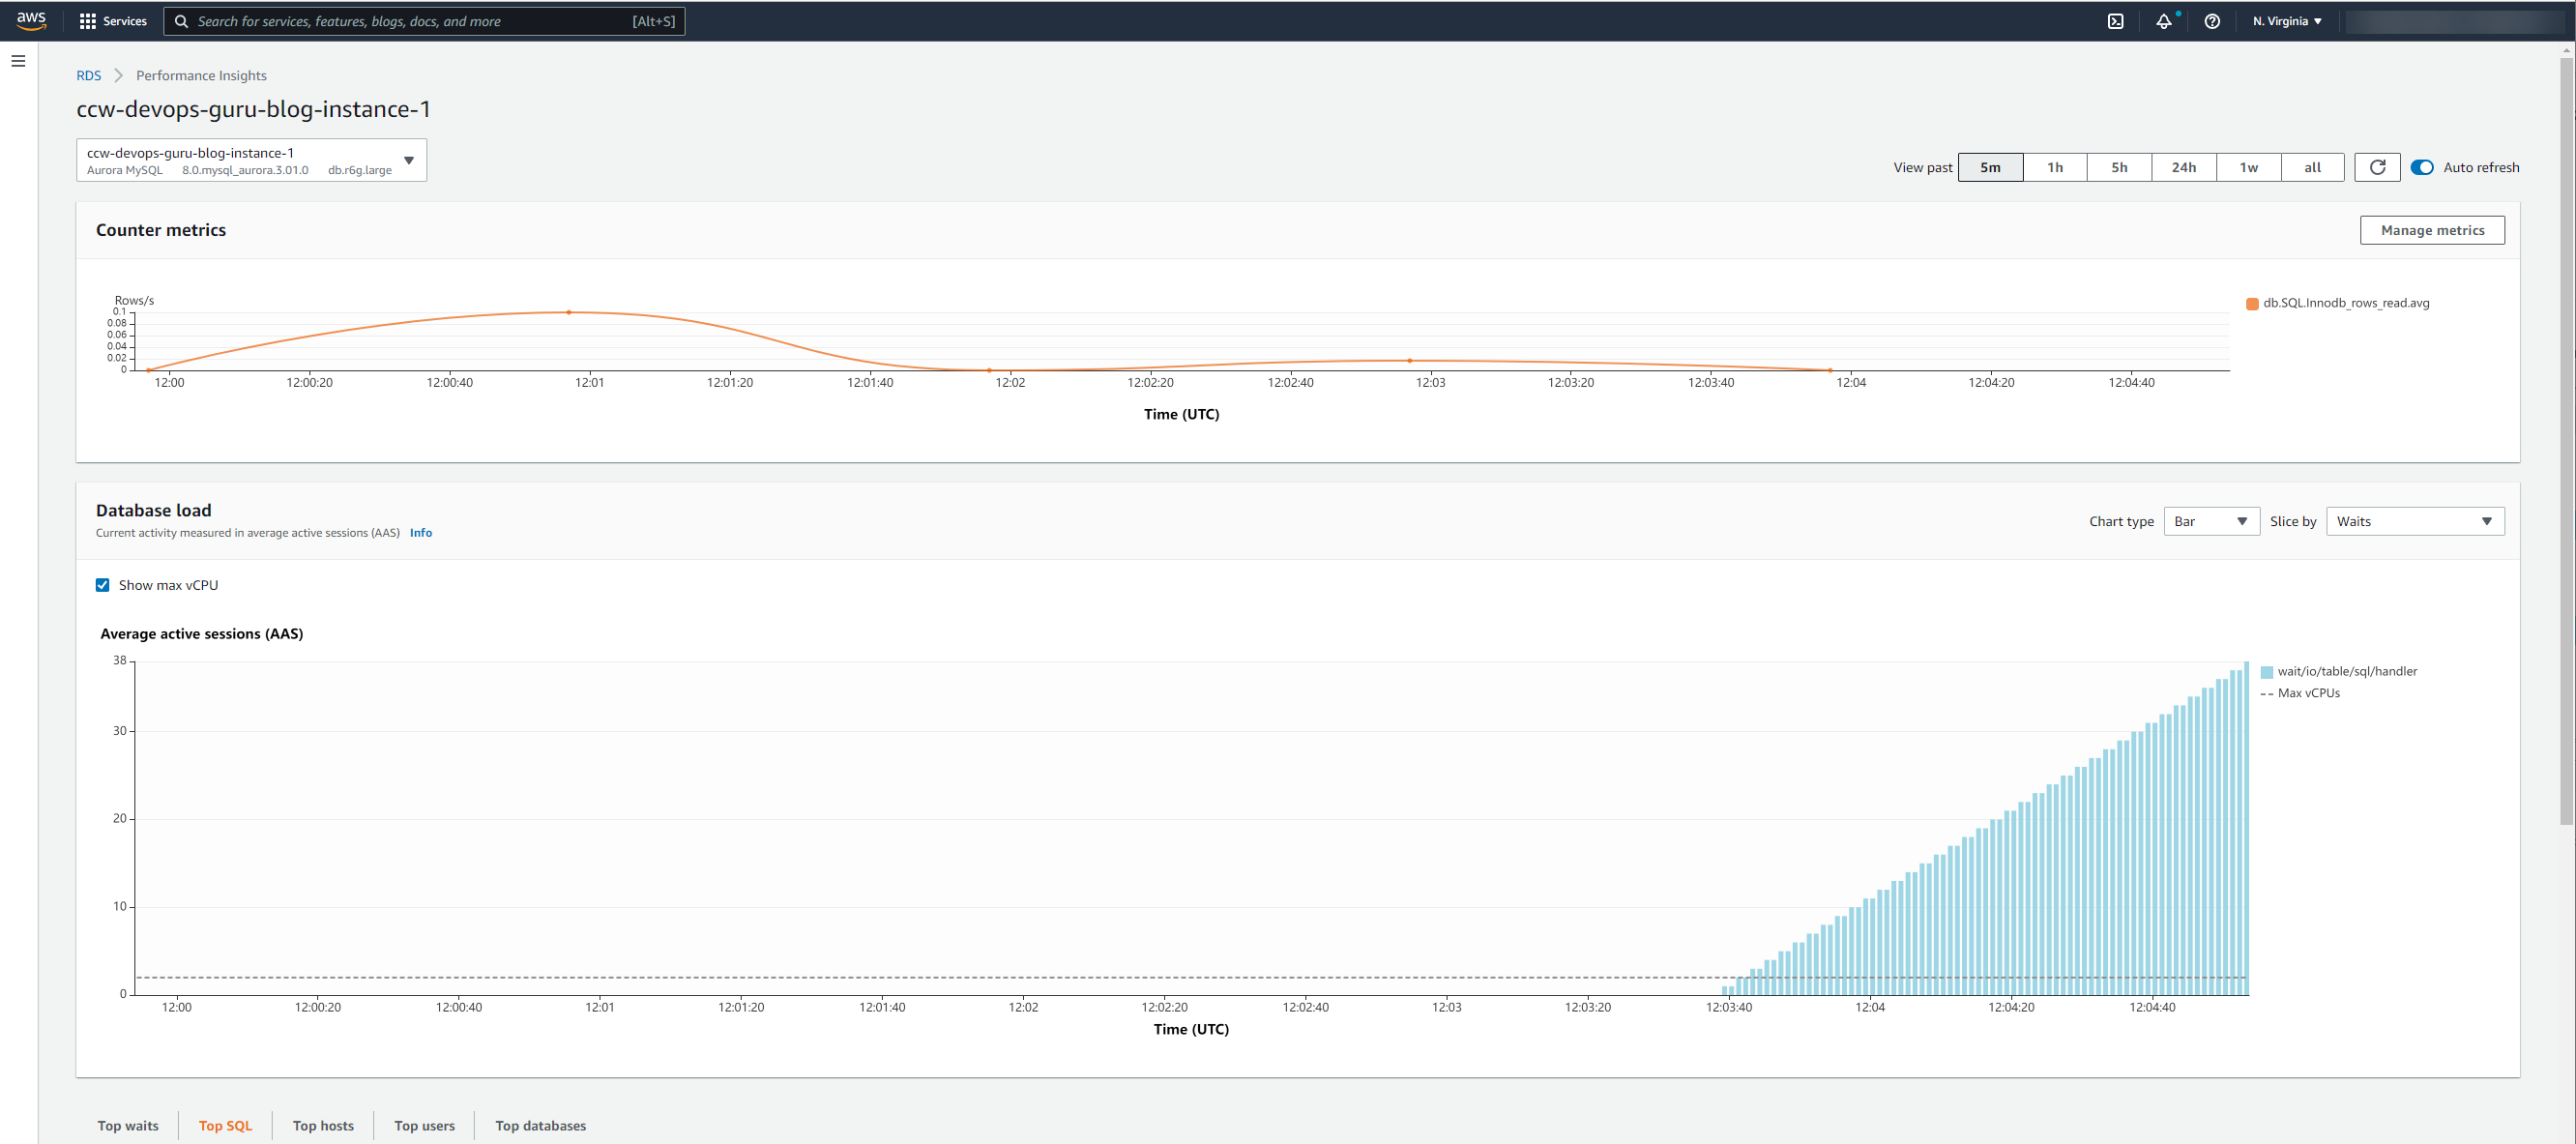
python3 ams_locking_scenario.py 1 1200 24.6 Step #06 – Monitor the database’s RDS Performance Insights
After a few minutes, the number of active sessions starts growing without limits
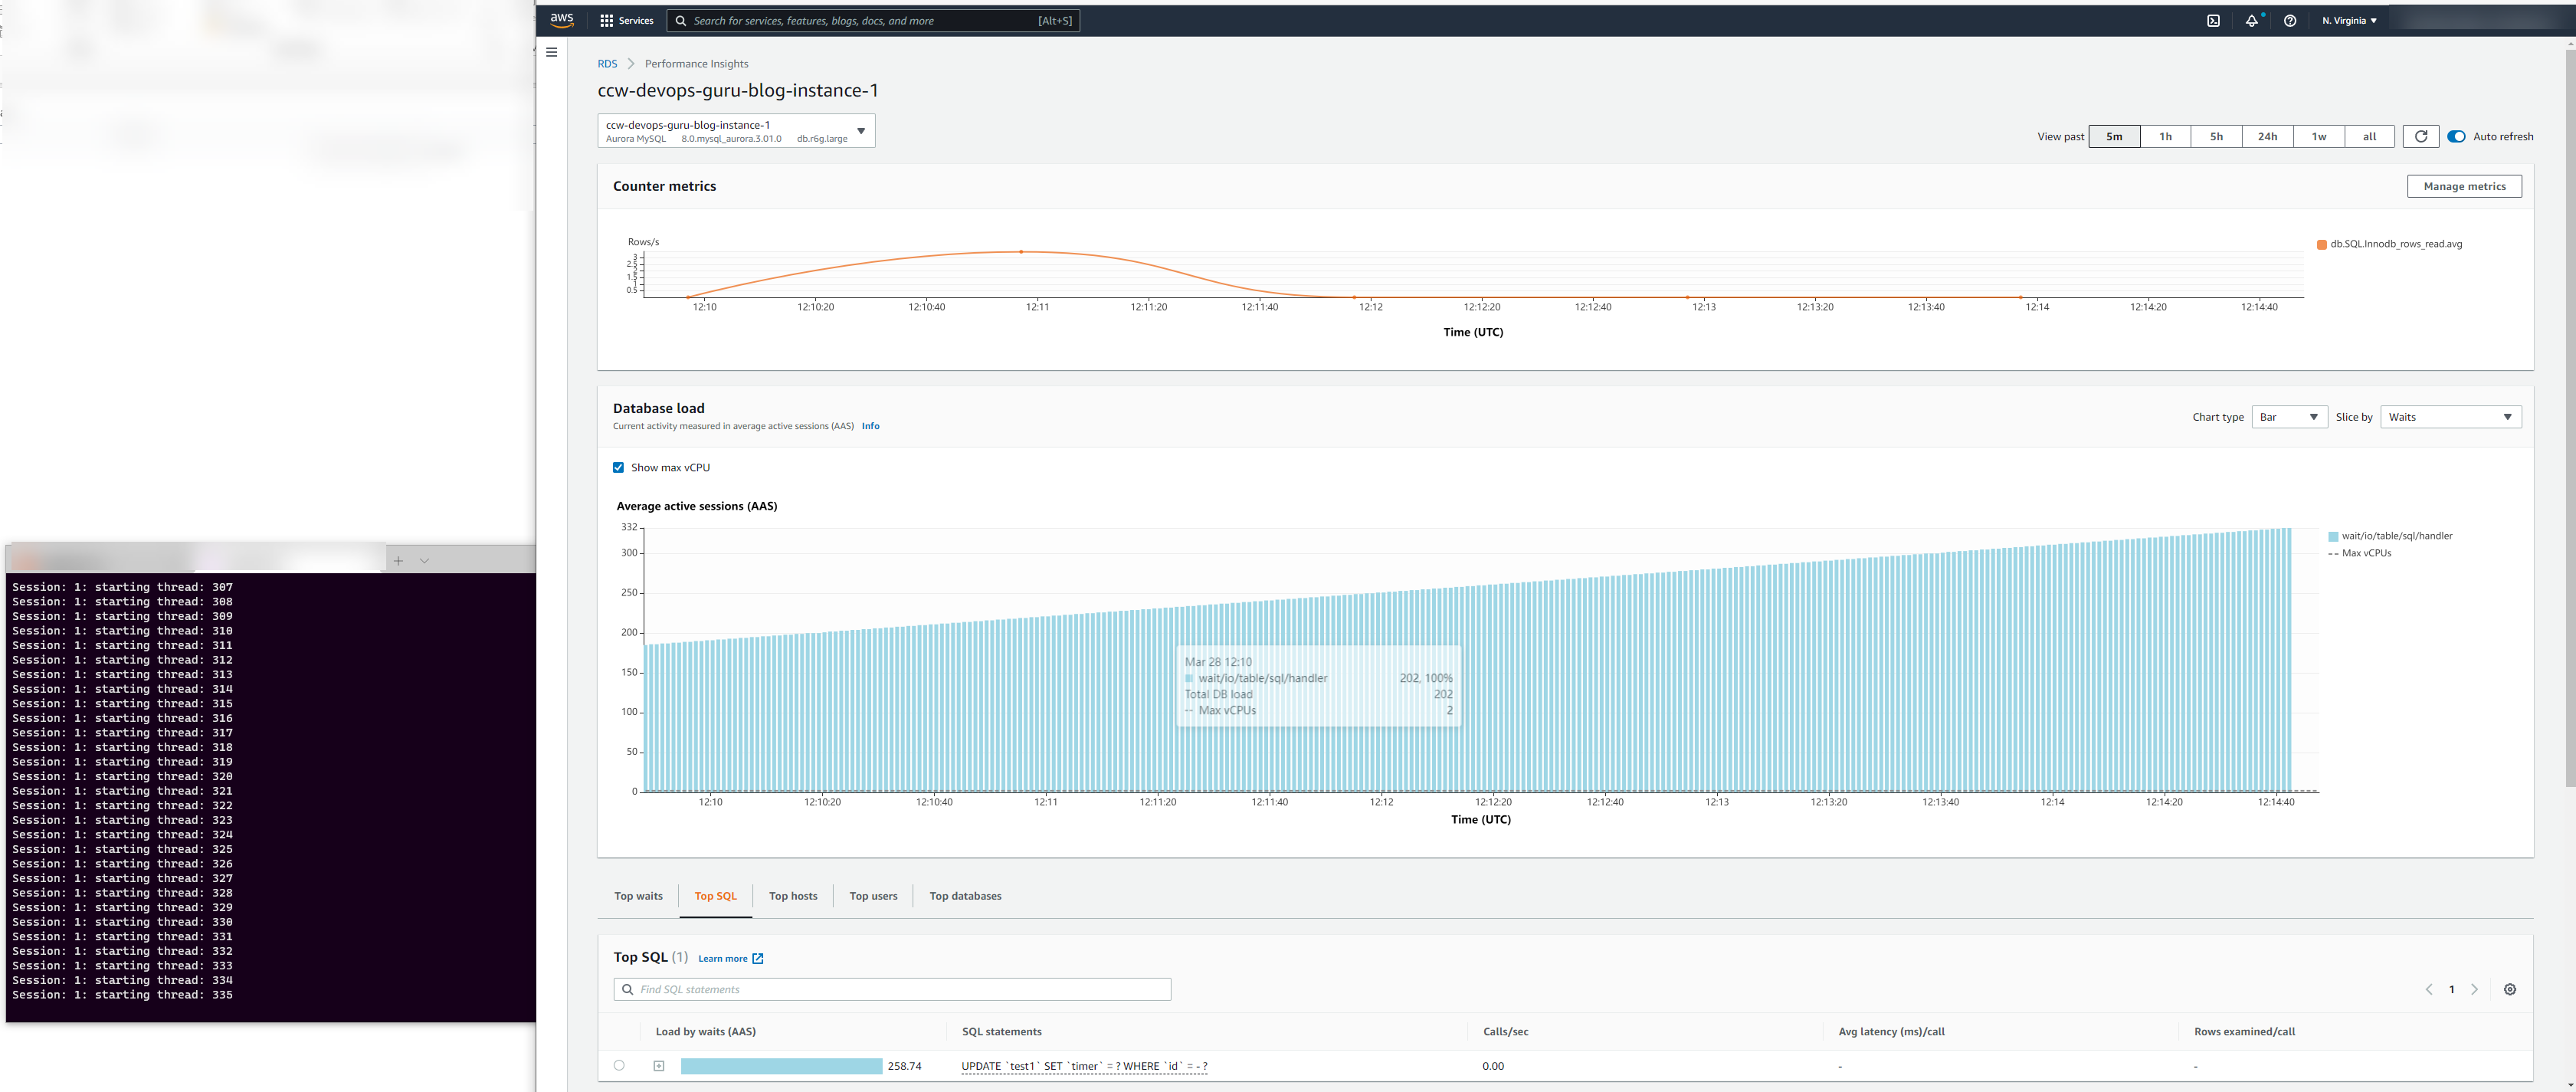
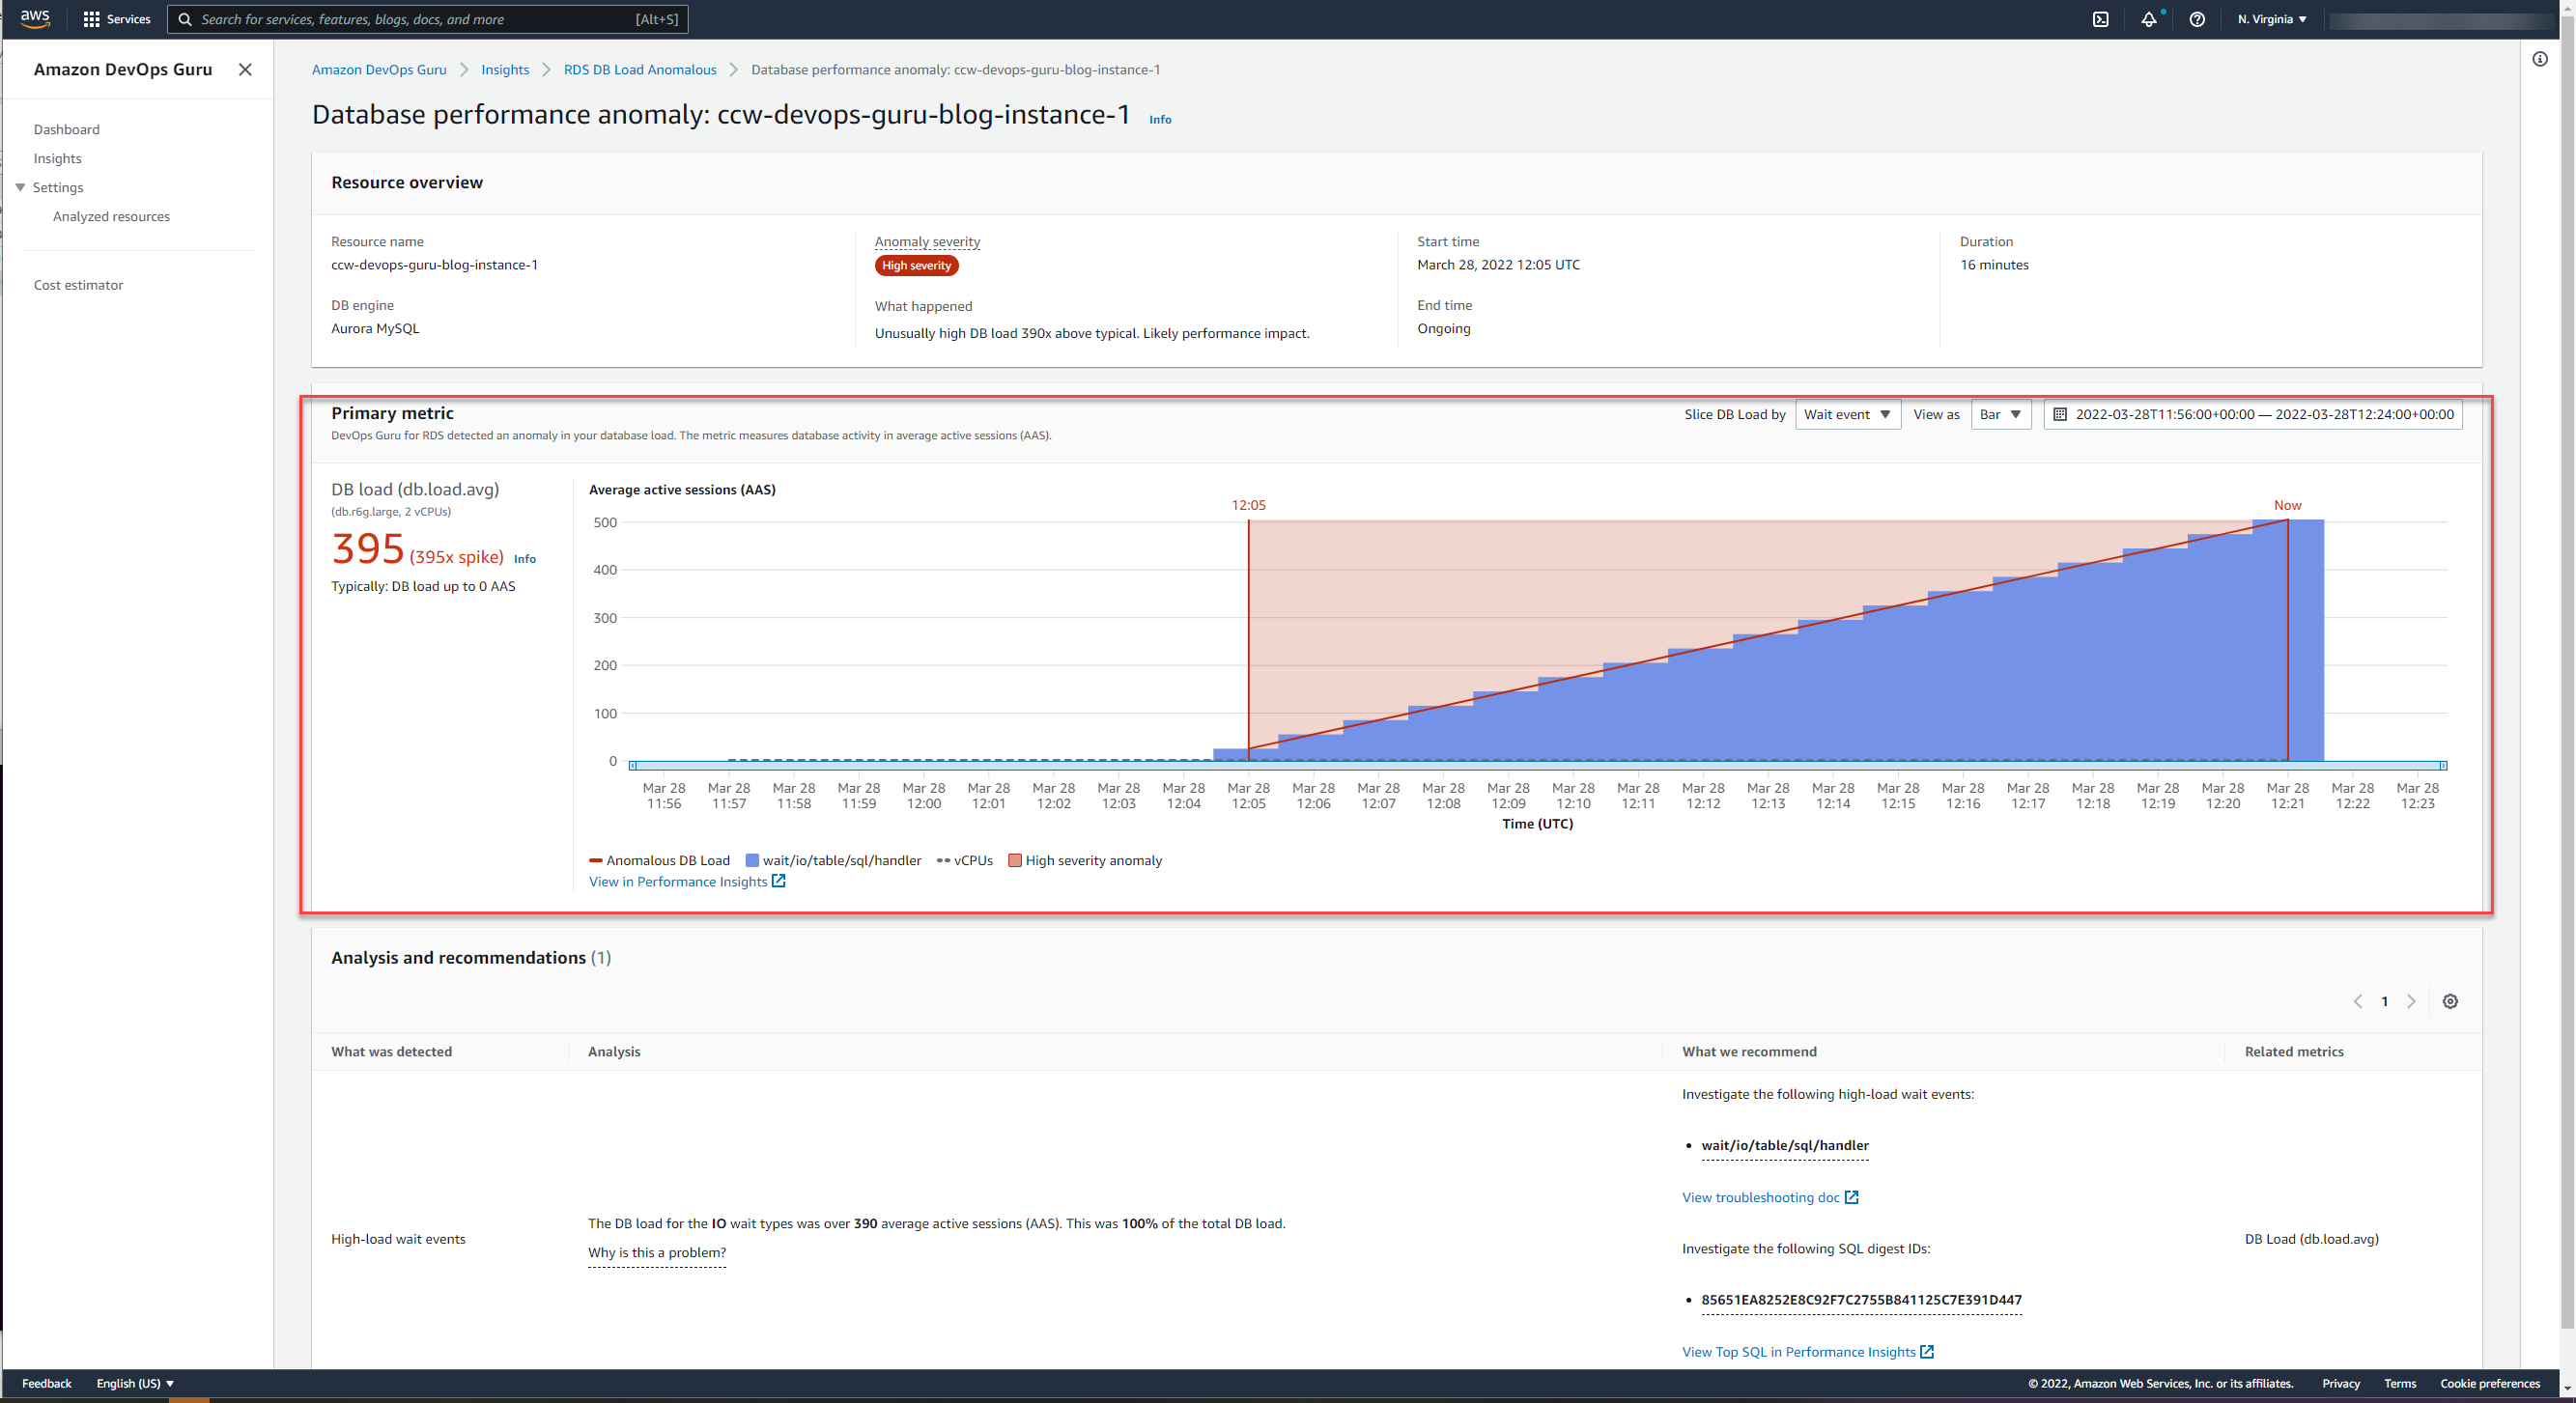
When we change the aggregation to one hour, after 15 minutes, DevOps Guru for RDS identifies the situation as an anomaly – see the red highlight:
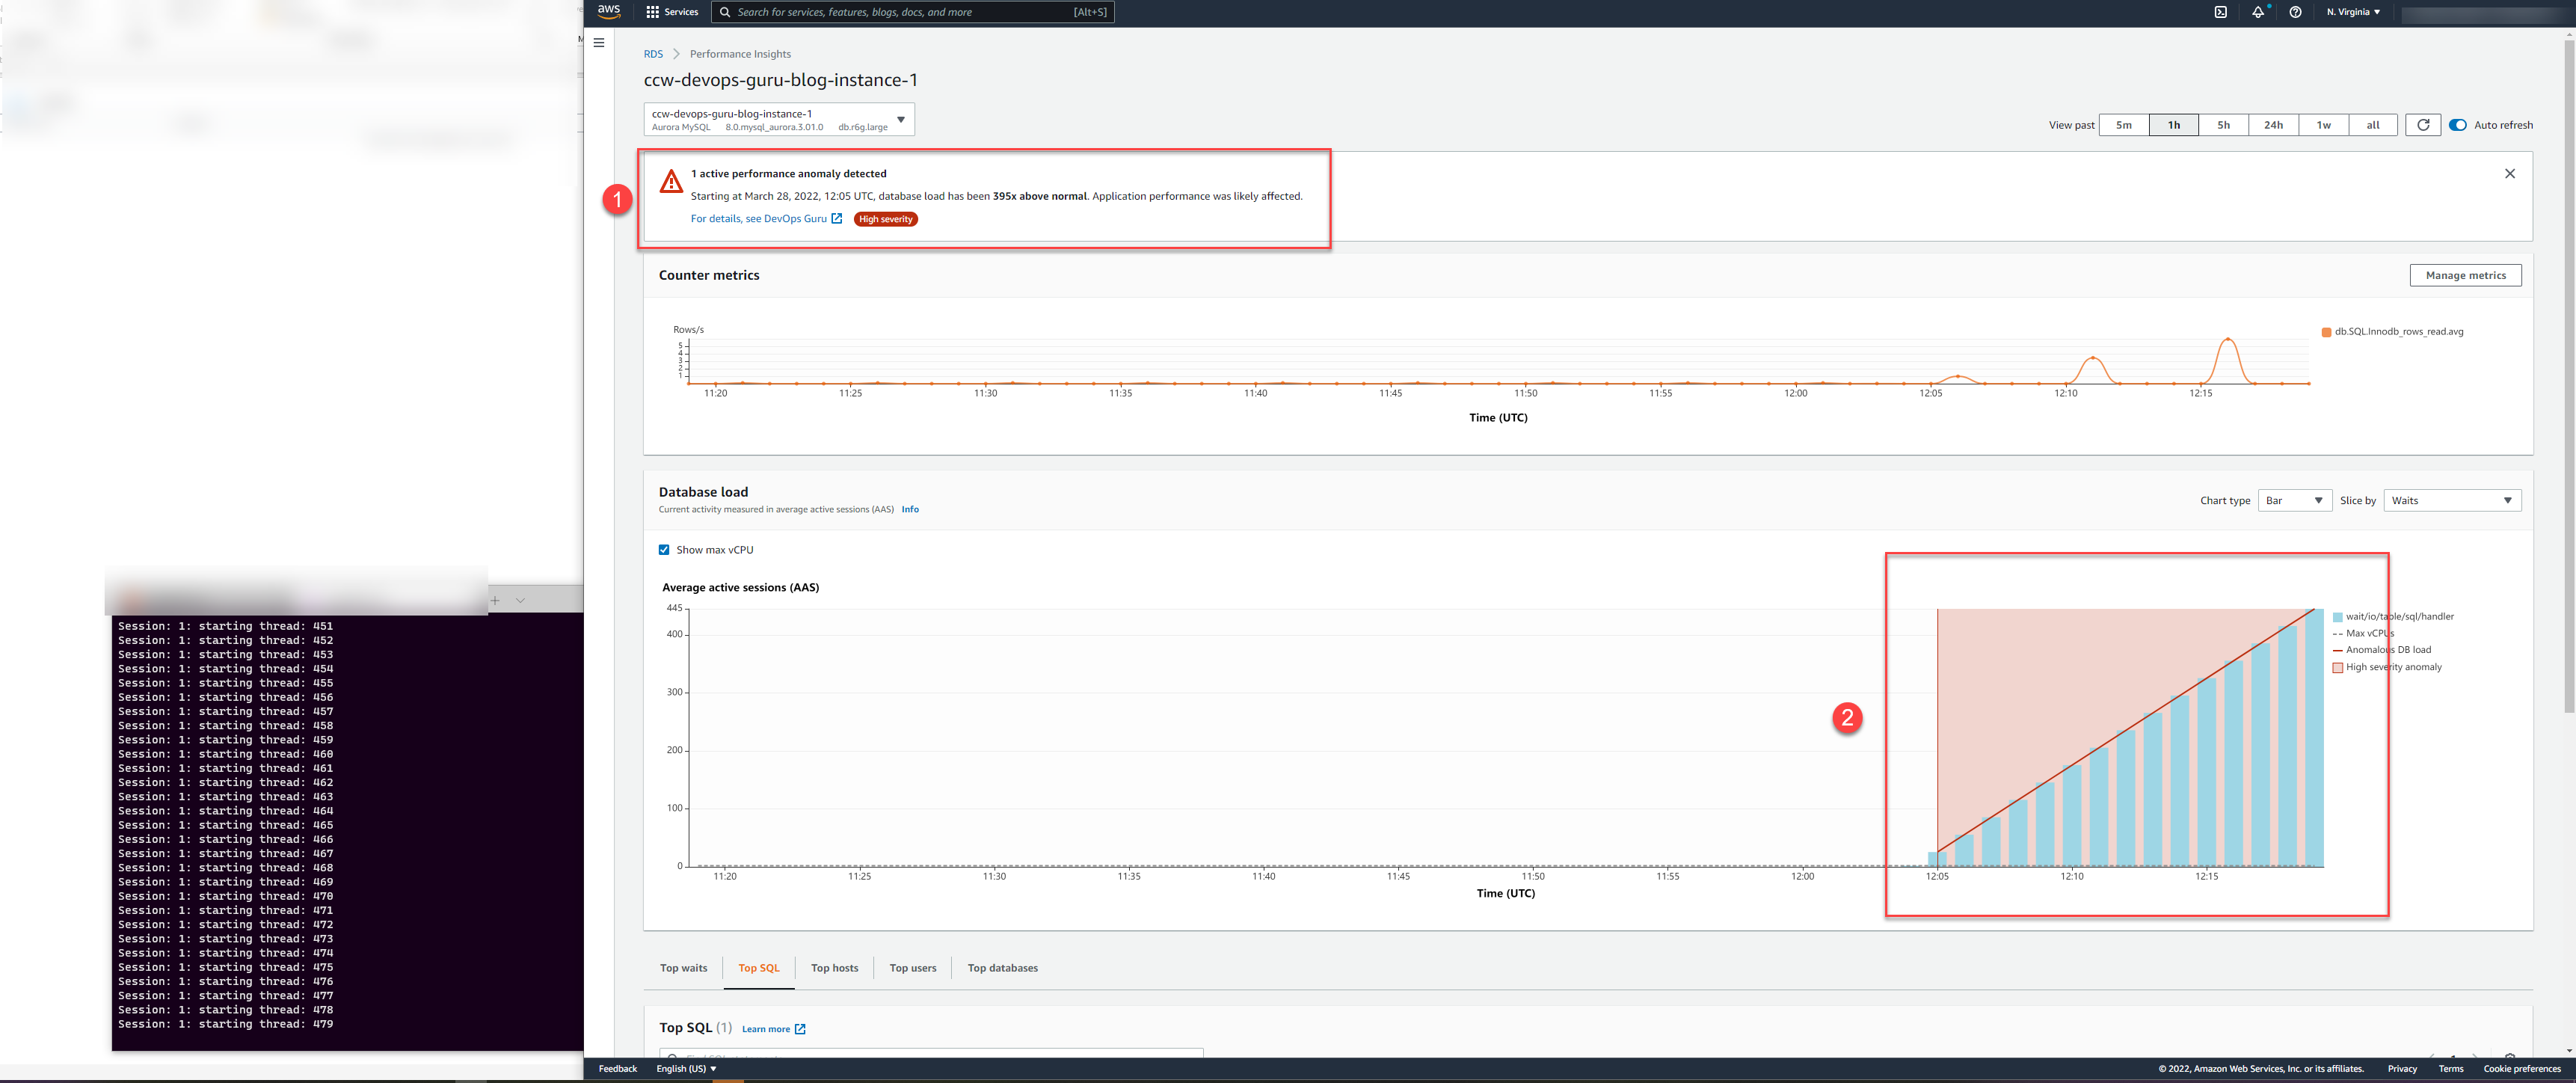
It immediately sends SNS alerts on anomalous RDS DB Load with the list of anomalies as an excessive number of Database Connections.
4.7 Step #7 – The same information can be viewed in the Amazon DevOps Guru Console
5. Summary
Amazon DevOps Guru for RDS is a critical tool for identifying and rectifying existing and potential operational problems on AWS RDS databases.
Oquant’s mBase strategy processes daily terabytes of historical and real-time market data in search of trade signals, allowing it to leverage the majority of AWS managed services in synergistic architectures at a larger scale than allowed by any other public cloud.
While we extensively utilize various types of time series and NoSQL databases, we run an AWS Aurora PostgreSQL RDS cluster for storing and rapidly querying trades, quotes, and trading algorithm results to identify potential market opportunities.
We use RDS Performance Insights for identification of the SQL queries causing performance bottlenecks and the RDS Performance Insights’ metric Database Load for rightsizing of the RDS instances. Thanks to DevOps Guru for RDS we are able to right-size each RDS instance far more aggressively than when doing manually because DevOps Guru for RDS alerts us each time the hardware resources are close to be exhausted – the CPU/Memory/Database Connections anomaly.
The Database Load metric and its use by DevOps Guru for RDS are the key differentiators from other database monitoring tools – the Database Load monitoring built into AWS Aurora with virtually no performance cost normalizes all relevant performance metrics to a single easy-to-interpret metric comparable with the number of vCPUs each database instance has. The other advantages of DevOps Guru for RDS include humanly understandable explanations of all database wait states and provided troubleshooting steps, and integration with SNS / CloudWatch.
The beauty of the RDS Performance Insights and DevOps Guru for RDS is that RDS Performance Insight’s identified SQL statements causing bottlenecks and DevOps Guru for RDS alerts allow instant prioritization of our code areas for further optimization.