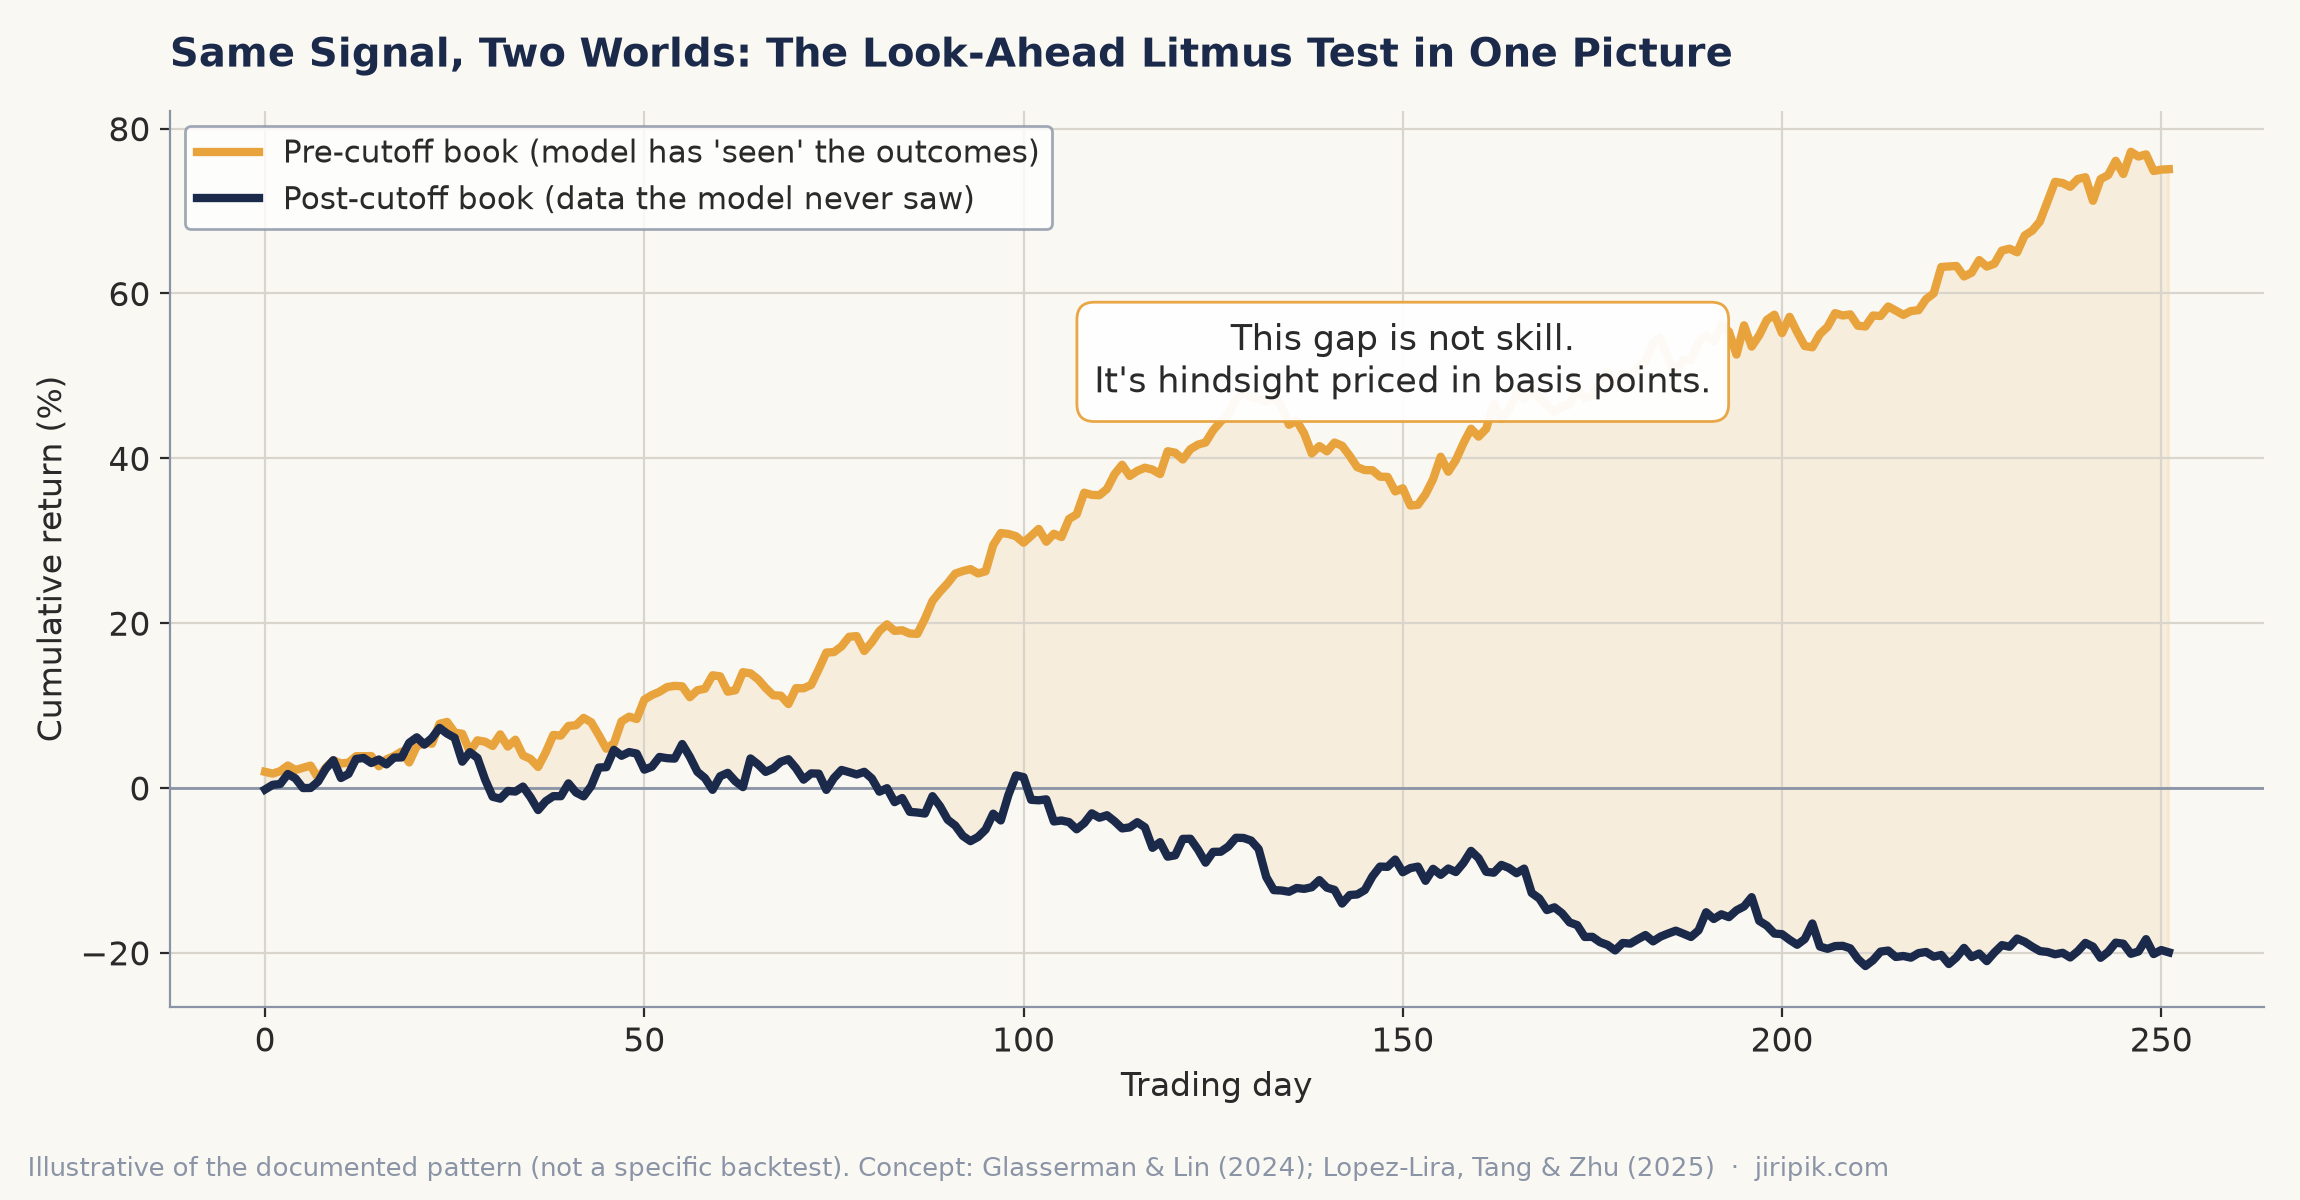
Line graph comparing cumulative returns (%) of a pre-cutoff model (yellow) and a post-cutoff model (blue) over 250 trading days, showing the pre-cutoff outperforming the post-cutoff significantly.

keyboard_arrow_up