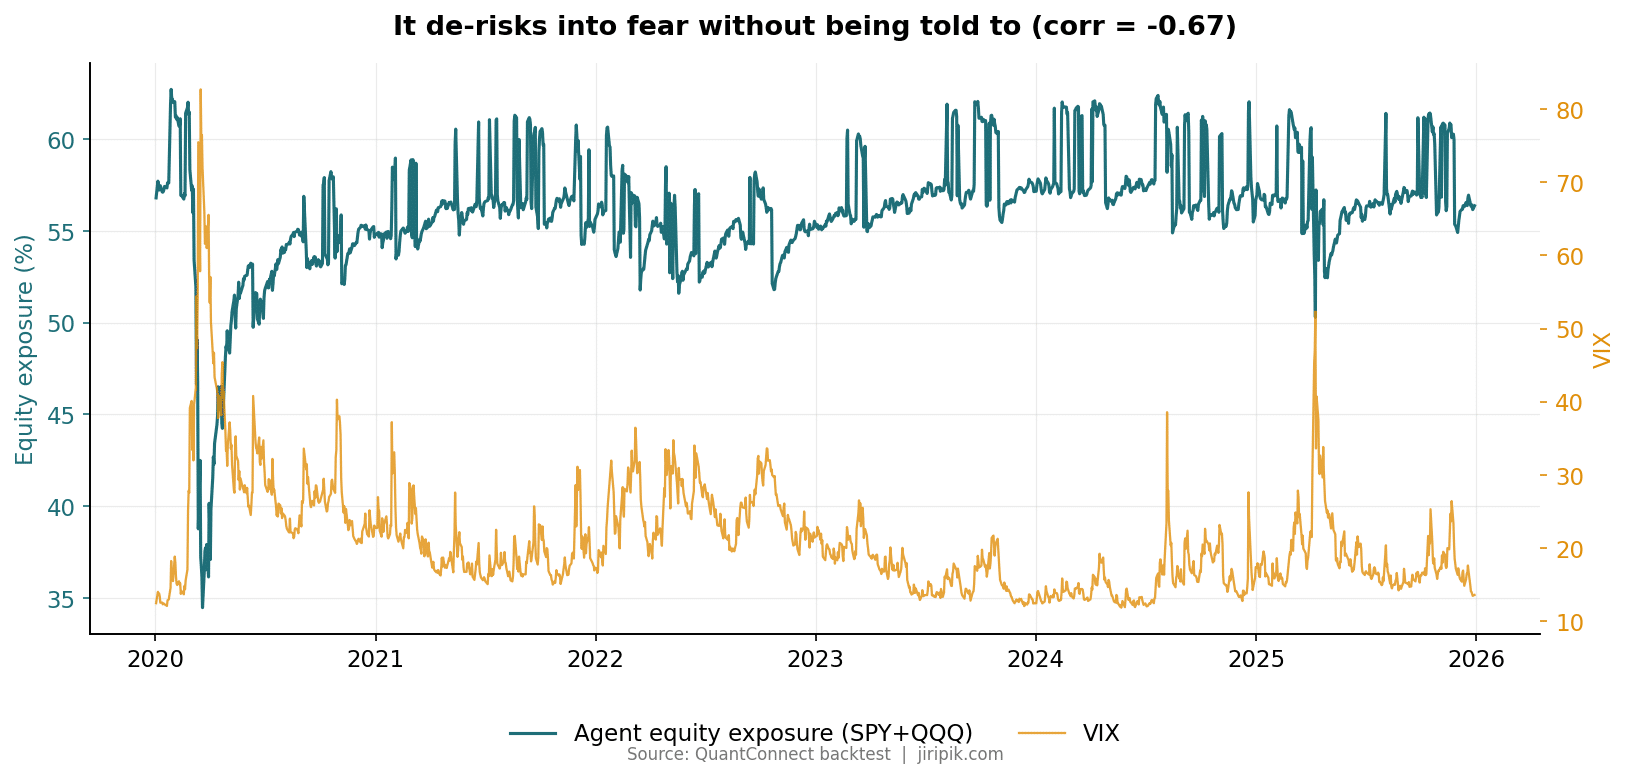
Line chart showing agent equity exposure (teal, left y-axis) and VIX (gold, right y-axis) from 2020 to 2026. Equity exposure drops as VIX spikes, illustrating a strong negative correlation (-0.67).

keyboard_arrow_up